
Subtracting Fractions Using an Area Model
Loading the math board and drawing, please wait…
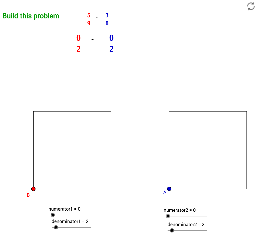
① This GeoGebra example demonstrates the subtraction of two fractions through a visual area model, allowing learners to see how the difference is represented by the remaining shaded region after removing one fractional part from another. ② The core mathematical concepts include fraction meaning, equivalent fractions, common denominators, fraction subtraction, and the geometric interpretation of partitioning a whole into equal parts, involving numerators, denominators, and greatest common divisor (GCD). ③ Construction highlights: using GeoGebra commands such as Point, Circle, OrthogonalLine, Intersect, Segment, Mirror, Sequence, Polygon, GCD, and Random to build a rectangular grid with dynamic subdivisions; key objects include numerator1, numerator2, denominator1, denominator2, squaresize, DotsBottom, DotsTop, DotsLeft, DotsRight, DashedLines1/2, and polygons poly1, poly2, poly3. The model randomly generates fractions)Skip and uses dashed lines and dot arrays to mark the subtracted portion, while the remaining area visually shows the result. ④ Suitable for upper elementary to middle school students learning fraction operations, and useful for teachers in classroom demonstrations or for students' self-exploration, as sliders or random buttons allow testing various fraction pairs to deepen understanding of common denominators and subtraction.
GeoGebra Commands & Parameters
Point(c) → ACircle(A, squaresize) → dOrthogonalLine(A, c) → eIntersect(d, e, 2) → B_1Intersect(d, c, 2) → CSegment(B_1, C) → fMirror(A, f) → A'Sequence((x(A) + (i * squareside / denominator2), y(A)), i, 1, denominator2) → DotsBottomSequence((x(B_1) + (i * squareside / denominator2), y(B_1)), i, 1, denominator2) → DotsTopPolygon(A, (x(A) + (numerator2 * squaresize / denominator2), y(A)), (x(B_1) + (numerator2 * squaresize / denominator2), y(B_1)), B_1) → poly1, a, h, i, jSequence(Segment[(x(A) + (i * squaresize / denominator2), y(A)), (x(B_1) + (i * squaresize / denominator2), y(B_1))], i, 1, denominator2) → DashedLines1Polygon(A, C, A', B_1) → poly2, a_1, c_1, a', b_1Point(c) → BCircle(B, squaresize) → gOrthogonalLine(B, c) → bIntersect(g, b, 2) → EIntersect(g, c, 2) → FOrthogonalLine(E, b) → kOrthogonalLine(F, c) → lIntersect(k, l) → GSequence((x(B), y(B) + (i * squaresize / denominator1)), i, 1, denominator1) → DotsLeftSequence((x(F), y(F) + (i * squaresize / denominator1)), i, 1, denominator1) → DotsRightSequence(Segment[(x(B), y(B) + (i * squaresize / denominator1)), (x(F), y(F) + (i * squaresize / denominator1))], i, 1, denominator1) → DashedLines2Polygon(B, F, (x(F), y(F) + (numerator1 * squaresize / denominator1)), (x(B), y(B) + (numerator1 * squaresize / denominator1))) → poly3, d_1, f_1, m, nPolygon(B, F, G, E) → poly4, d_2, f_2, g_1, e_1GCD(MixedNum, commondenom) → ReduceByRandom(2, 10) → seeddenominator1Random(2, 10) → seeddenominator2
AI Drawing Prompt Reference
Create a visual area model for subtracting fractions. Draw two equal-sized squares placed side by side. The left square is divided into equal horizontal strips, with a portion shaded to represent the first fraction. The right square is divided into equal vertical columns, with a portion outlined by dashed lines and shaded to represent the second fraction. Align the two fractions using a common denominator, and show the remaining unshaded area as the result of subtraction. Include dot markers at division points and dashed guide lines for clarity. The layout should be clean and suitable for educational demonstration.
The prompt above was compiled from the original drawing commands and is for reference only.