
Stretched vs. Compressed Graphs
Loading the math board and drawing, please wait…
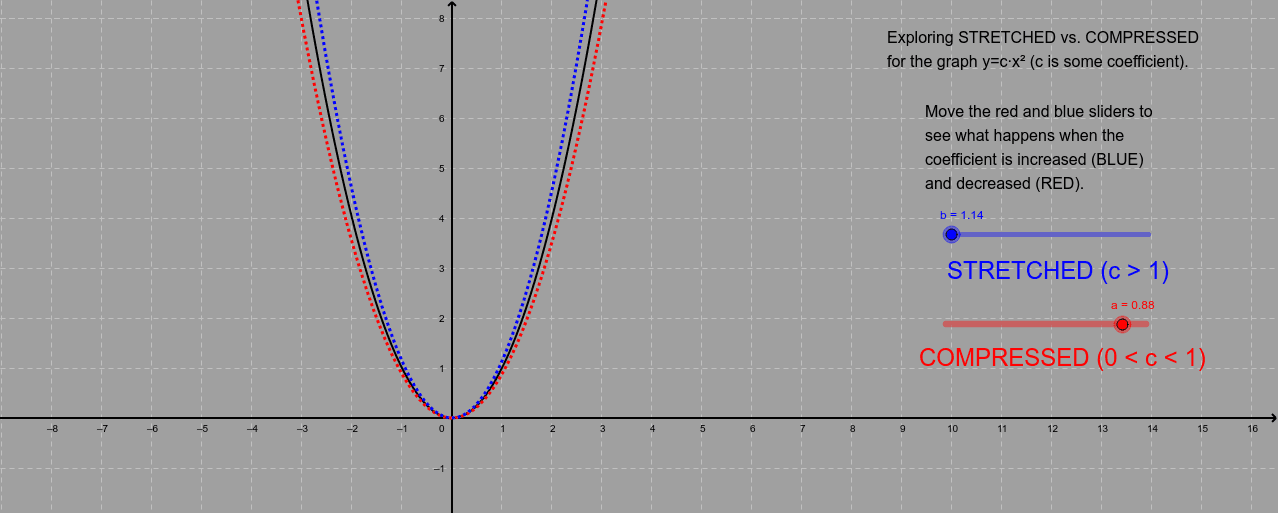
This example demonstrates the concept of stretched and compressed graphs using a parabola. It involves core math concepts like function graph transformations, stretch/compression coefficients, and coordinate geometry. Constructed using GeoGebra objects: sliders a and b, functions f, g, h, and text elements text1, text2, text3, text4. Ideal for high school students to explore function transformation properties and the impact of stretch on graph shapes.
GeoGebra Commands & Parameters
Numeric a(0.88)Numeric b(1.14)f(x) = x^(2)g(x) = (a * x^(2))h(x) = (b * x^(2))
AI Drawing Prompt Reference
Draw a graph showing the effect of stretching and compressing a parabola, including two sliders controlling stretch coefficients, and three function graphs, one being a standard parabola and the other two being the stretched and compressed versions of the standard parabola, to illustrate how the stretch coefficient affects the shape of the parabola.
The prompt above was compiled from the original drawing commands and is for reference only.