
Exploring Asymptotes
Loading the math board and drawing, please wait…
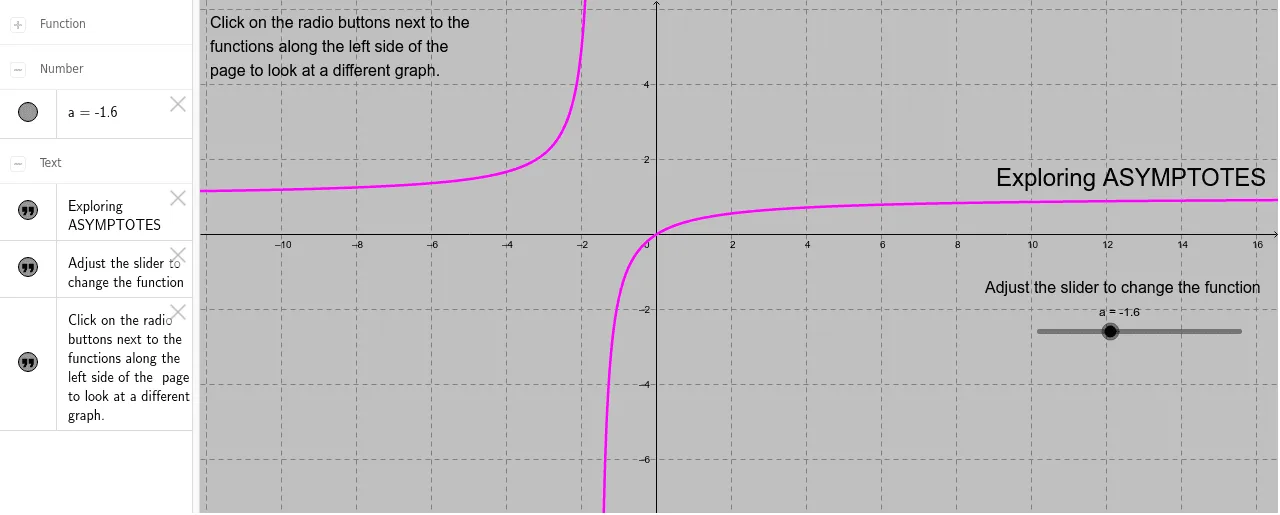
Students can explore the nature of asymptotes using this interactive worksheet by looking at the graphs of 5 different functions that have asymptotes. The example demonstrates function graphs, asymptotes, and limits. It is constructed using GeoGebra commands/objects: a, f, g, text1, text2, text3, h, i, j. Suitable for high school mathematics teaching or self-study to understand the asymptotic behavior of functions.
GeoGebra Commands & Parameters
Numeric a(-1.6)f(x) = sin((9 * x)) / (x^(2) - a)g(x) = (x^(3) - 8) / (x^(2) - a)h(x) = (x - 6) / (x^(4) + (3 * x) - a)i(x) = ((a * tan(x))) / xj(x) = x / (x - a)
AI Drawing Prompt Reference
Draw the graphs of five functions: a sine function divided by a quadratic function minus a negative number, a cubic function divided by a quadratic function minus a negative number, a linear function divided by a quartic function plus a linear function minus a negative number, a negative number times the tangent function divided by the variable, and the variable divided by the variable minus a negative number, labeling their asymptotes.
The prompt above was compiled from the original drawing commands and is for reference only.