
Straight Line Graphs Animation
Loading the math board and drawing, please wait…
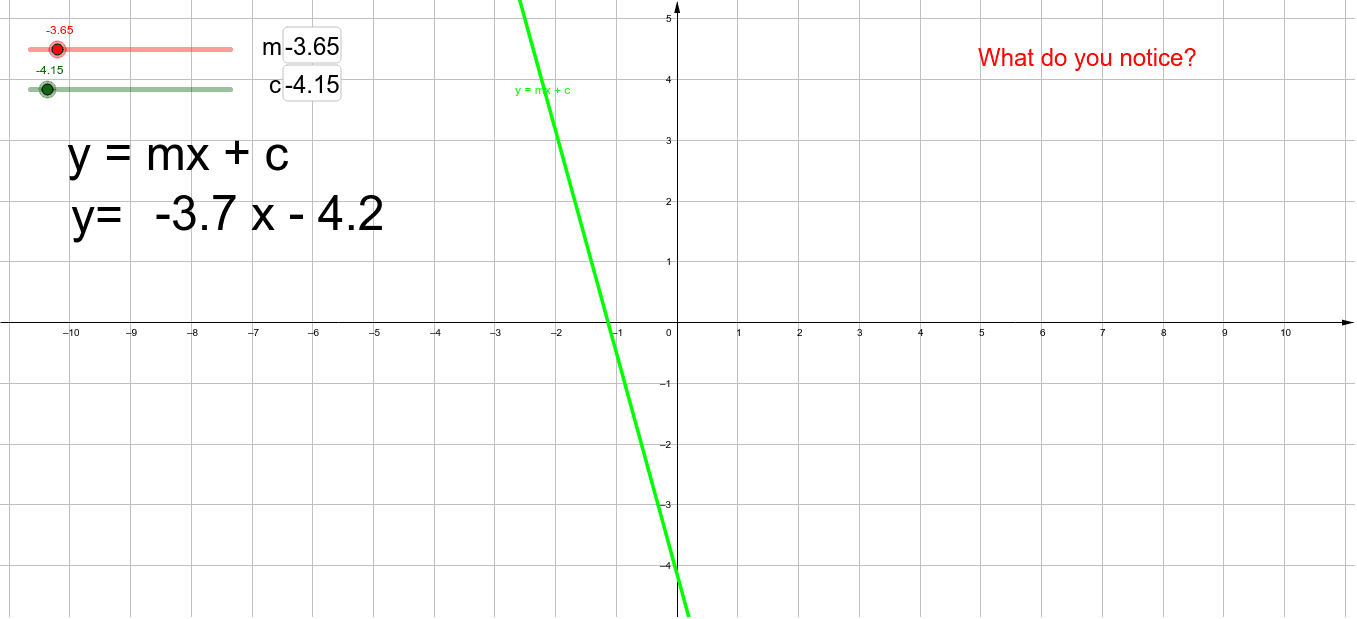
This example demonstrates the dynamic changes of the straight line equation y = mx + c by adjusting the slope m and y-intercept c with sliders. It uses commands like Text and Textfield in GeoGebra and is suitable for students from middle school and above to learn about straight line equations and function graphs.