
Straight Line Graph
Loading the math board and drawing, please wait…
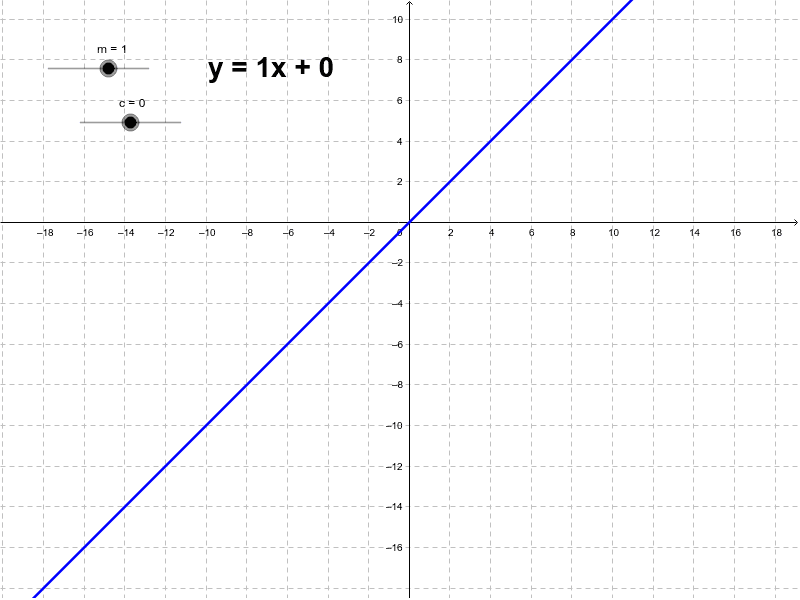
This example demonstrates the graph of the linear equation y = mx + c, where the values of m and c can be adjusted using sliders to observe changes in the line. Key mathematical concepts include linear equations, slope, and y-intercept. It utilizes GeoGebra's slider and text objects. Suitable for middle school and above students to learn about linear equations and coordinate geometry.
GeoGebra Commands & Parameters
Numeric m(1.0)Numeric c(0.0)y = m * x + c
AI Drawing Prompt Reference
Draw a straight line with the equation y = mx + c, where m and c can be adjusted using sliders. First, draw the x-axis and y-axis. Then, dynamically generate the line based on the values of m and c. Changing the value of m will alter the slope of the line, while changing the value of c will move the line's intersection with the y-axis.
The prompt above was compiled from the original drawing commands and is for reference only.