
Step Function Exploration
Loading the math board and drawing, please wait…
In collections
Calculus C01_Limits&Their Properties
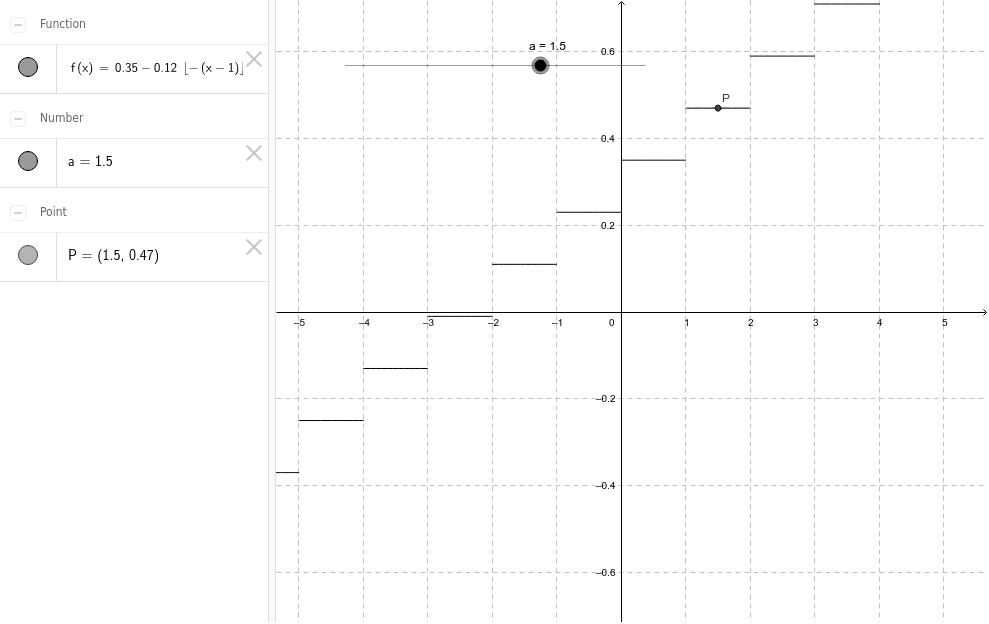
This example demonstrates the graph of a step function and its properties as parameters change. It involves core math concepts like function graphing, definite integral in calculus, and geometric mean. Constructed using GeoGebra commands/objects: f (function), a (parameter), P (point). Suitable for high school students and math enthusiasts to understand function properties and calculus applications.
GeoGebra Commands & Parameters
f(x) = 0.35 - 0.12 * floor(-(x - 1))Numeric a(1.5)(a, f(a))
AI Drawing Prompt Reference
Draw the graph of a piecewise constant function, where the function remains constant within each interval, and show how the parameter a affects the function's graph. First, plot the basic piecewise constant function, then mark the value of parameter a and draw a point at the position of the parameter to show how the function value changes as the parameter varies.
The prompt above was compiled from the original drawing commands and is for reference only.