
Statistics: Cumulative Histograms of S&P 500 Stock Data
Loading the math board and drawing, please wait…
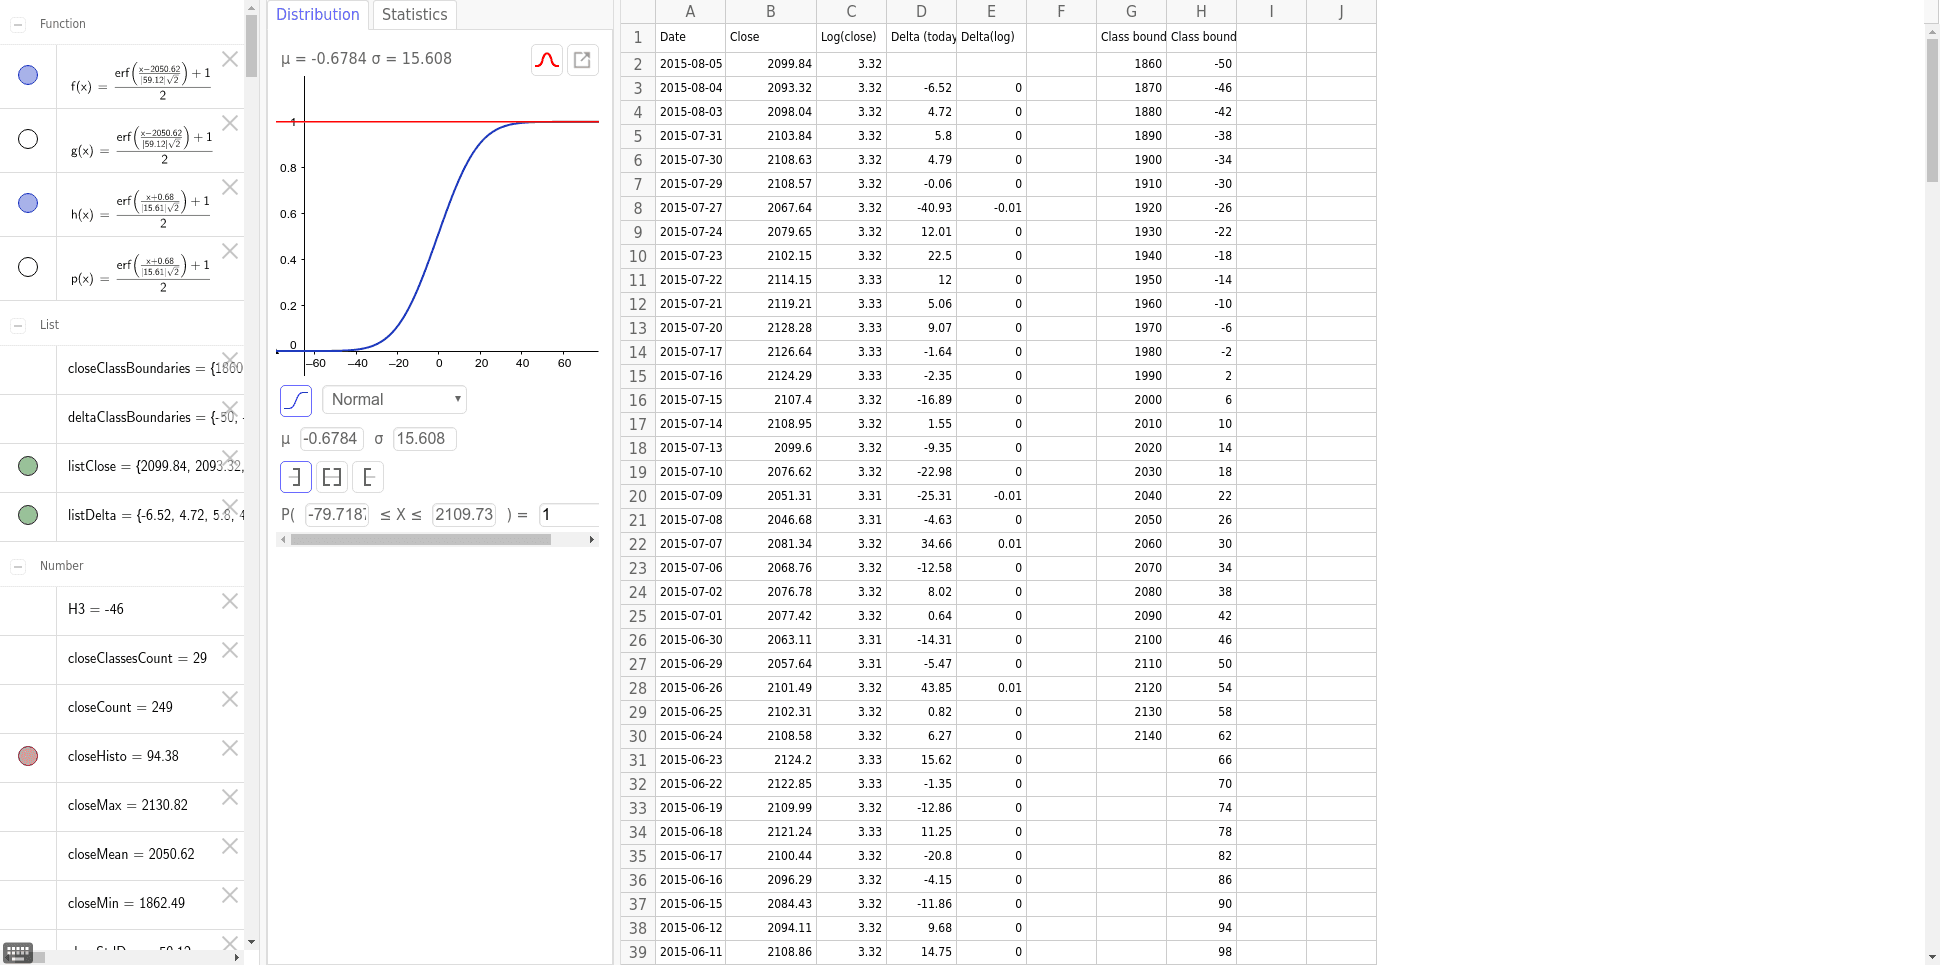
This example demonstrates cumulative histograms of S&P 500 stock data, involving key statistical concepts. Using GeoGebra commands such as Min, Max, Mean, Variance, etc., it provides a clear analysis of data distribution. Suitable for high school students and researchers.
GeoGebra Commands & Parameters
Min(listClose) → closeMinMax(listClose) → closeMaxMean(listClose) → closeMeanVariance(listClose) → closeVariancePoint(xAxis) → APoint(xAxis) → BLength(B2:B250) → closeCountLength(G2:G30) → closeClassesCountMin(listDelta) → deltaMinMax(listDelta) → deltaMaxMean(listDelta) → deltaMeanSD(listDelta) → deltaStdDevLength(D3:D250) → deltaCountLength(deltaClassBoundaries) → deltaClassesCountHistogram(true, deltaClassBoundaries, listDelta, true, 4 / deltaCount) → deltaHistoPoint(xAxis) → CPoint(xAxis) → DHistogram(true, closeClassBoundaries, listClose, true, 10 / closeCount) → closeHisto