
Standardizing the Normal Distribution (Transformations)
Loading the math board and drawing, please wait…
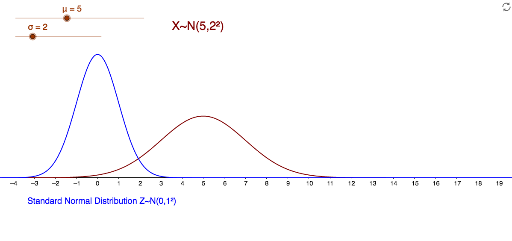
This example demonstrates how adjusting the mean (μ) and standard deviation (σ) transforms a normal distribution curve. Core math concepts include Normal Distribution, Standard Deviation, Statistics, Riemann Sum, Exponential Functions, Cosine, Interest Calculation, Random Variables. It is constructed using GeoGebra commands like Normal for the function f, sliders for μ and σ, function g for the transformed curve, variable a for integration bounds, and text object text1_1. Suitable for high school and above students/teachers in mathematics and statistics for teaching and exploration.
GeoGebra Commands & Parameters
Normal(μ, σ, x, false) → fNormal(0, 1, x, false) → g
AI Drawing Prompt Reference
Draw a normal distribution curve, showing its transformation by sliding mean and standard deviation. One curve is based on mean and standard deviation parameters, the other is a standard normal distribution. Use an integral bound variable and text to explain mathematical concepts, suitable for teaching and exploration.
The prompt above was compiled from the original drawing commands and is for reference only.