
Standard Deviation of Sample Means Demo
Loading the math board and drawing, please wait…
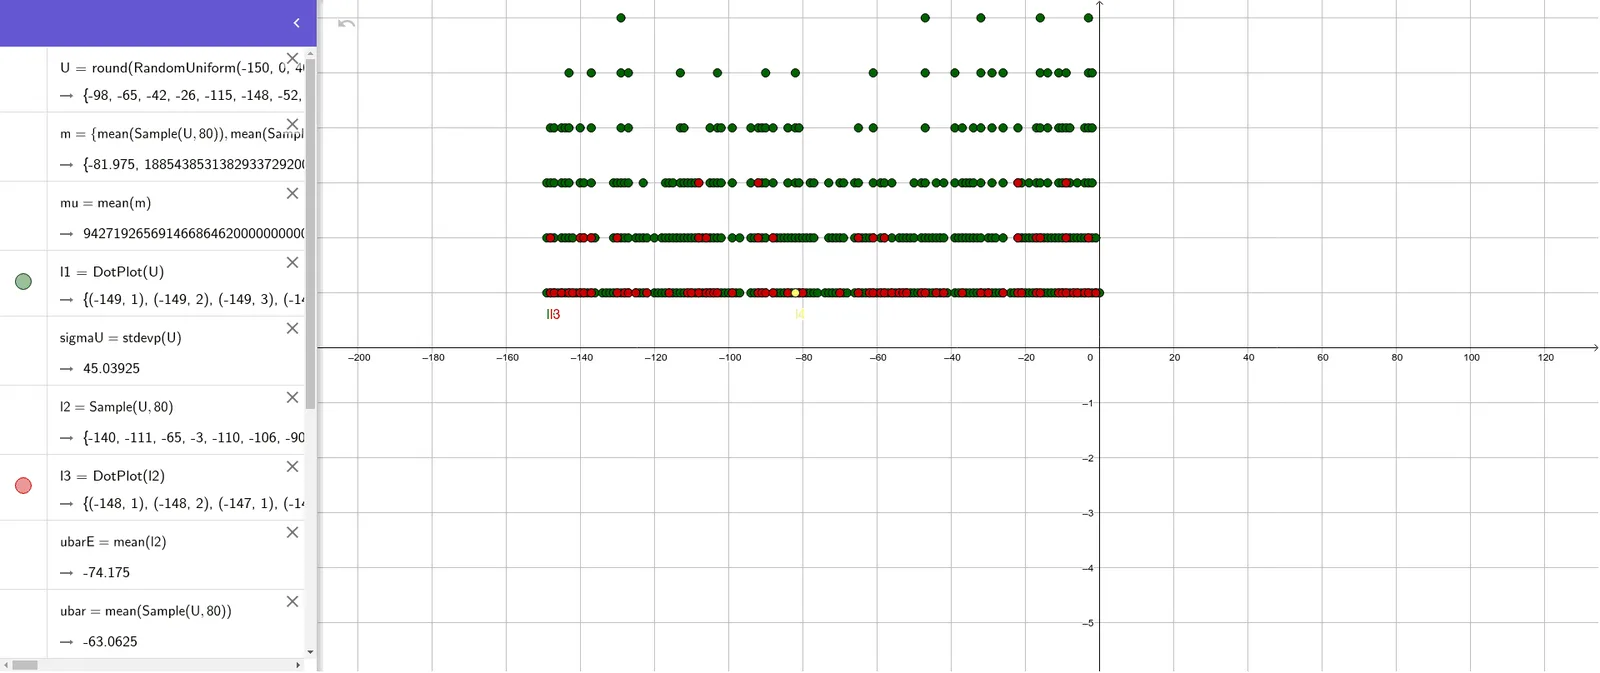
This example demonstrates the distribution pattern of the standard deviation of sample means. Key math concepts include sample mean, standard deviation, normal distribution, and sampling distribution. GeoGebra commands used are mean for calculating mean, DotPlot for plotting sample distribution, stdevp for sample standard deviation, and Sample for generating sample data. Suitable for introductory university statistics courses.
GeoGebra Commands & Parameters
mean(m) → muDotPlot(U) → l1stdevp(U) → sigmaUSample(U, 80) → l2DotPlot(l2) → l3mean(l2) → ubarEmean(Sample[U, 80]) → ubarstdevp(l2) → sEstdevp(Sample[U, 80]) → sDotPlot(m) → l4mean(m) → mbarEmean(m) → mbarstdevp(m) → smE