
Standard Deviation and Mean: A 3D Vector and Matrix Rotation Visualization
Loading the math board and drawing, please wait…
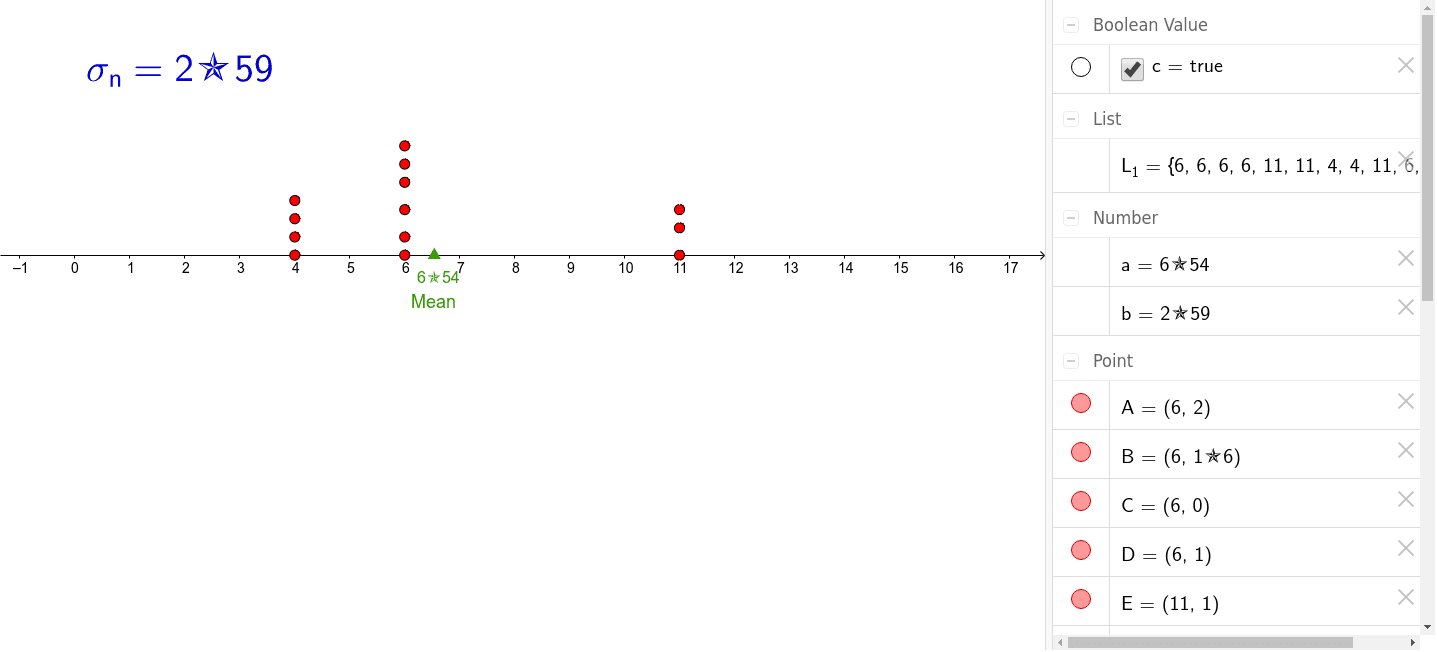
①This GeoGebra example dynamically demonstrates the geometric meaning of standard deviation and mean within a three-dimensional vector space, incorporating matrix rotation, median line, and circumcircle to visualize data dispersion. ②Core mathematical concepts include standard deviation, mean, matrix transformations, 3D vectors, rotation, median line, and circumcircle, bridging statistics and geometry. ③Construction highlights: Uses GeoGebra commands Mean and SD to compute statistics; objects include multiple points (A to M, A1 to A13), vector L_1, line a, circle b, texts text1-3, and auxiliary lines c, d, e, f, g; matrix rotation and 3D vectors illustrate data distribution and statistical measures. ④Suitable for high school to undergraduate statistics and geometry teaching, helping students understand how standard deviation measures data spread and how matrix transformations affect distributions, also useful for math experiments and inquiry-based learning.
GeoGebra Commands & Parameters
Mean(L_1) → aSD(L_1) → b