
Squares Set Demonstration
Loading the math board and drawing, please wait…
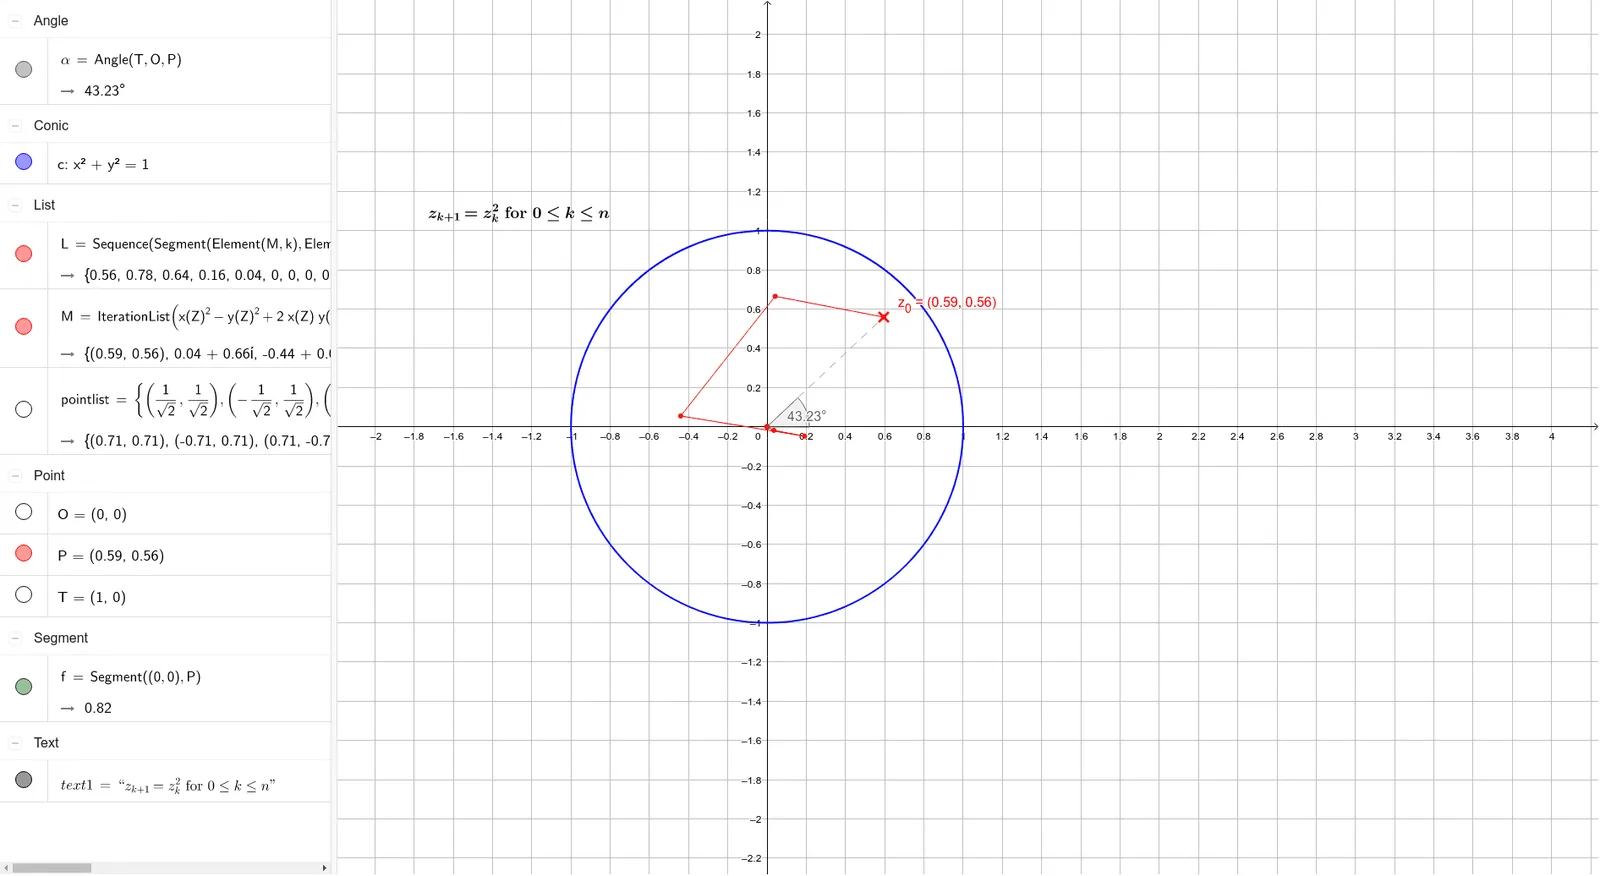
This example demonstrates the set distribution of squares at varying angles and positions; core math concepts include complex numbers, square construction, median value calculation, plane figures, equation solving, geometric distribution, and angle measurement; construction highlights involve commands/objects like Segment (line segment), Angle (angle), IterationList (iteration list), and Sequence from GeoGebra; suitable for high school mathematics teaching to understand the correlation between complex numbers and geometric figures, and for dynamic geometry demonstrations.
GeoGebra Commands & Parameters
Segment((0, 0), P) → fAngle(T, O, P) → αIterationList(x(Z)^(2) - y(Z)^(2) + (((2 * x(Z)) * y(Z)) * ί), Z, {P}, 20) → MSequence(Segment[Element[M, k], Element[M, k + 1]], k, 1, 20) → L
AI Drawing Prompt Reference
Draw a set of squares distributed at varying angles and positions to demonstrate the correlation between complex numbers and geometric figures. Start by drawing a line segment from the origin to point P, then measure the angle between points T, O, and P. Next, use an iteration list to generate a series of points through complex number operations, and finally connect these points sequentially with line segments to form a dynamic display of squares.
The prompt above was compiled from the original drawing commands and is for reference only.