
Square Root Graph via Random Walk Construction
Loading the math board and drawing, please wait…
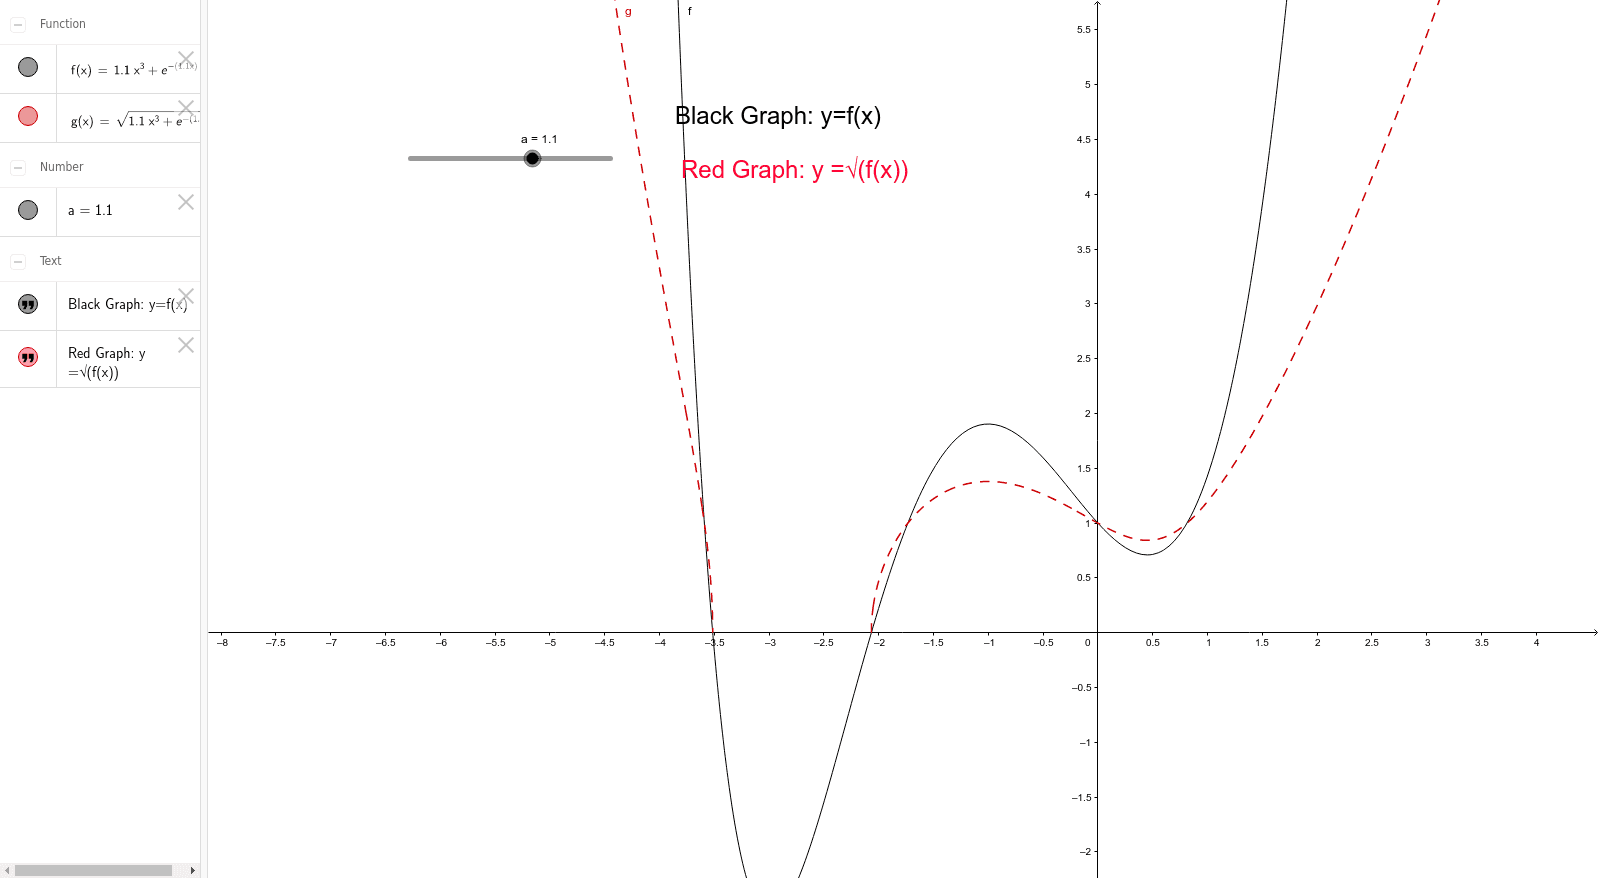
This example dynamically constructs the graph of the square root function y=√x through a random walk process, visually demonstrating how function values change as the independent variable increases. Core mathematical concepts include the square root function, stochastic processes (random walks), rotation and 3D solids, as well as trigonometric functions and equilateral triangles. Construction highlights: using GeoGebra objects a, f, g, and texts text1 and text2, the random walk generates a sequence of points, which are then transformed via rotation and 3D solid operations to ultimately trace the square root curve. Suitable for high school and above, this example is ideal for learning the combination of function graphs and stochastic processes, and for mathematical modeling or visualization to understand the interplay between function growth rates and randomness.
GeoGebra Commands & Parameters
Numeric a(1.1)f(x) = (a * x^(3)) + exp((-((a * x))))g(x) = sqrt(f(x))
AI Drawing Prompt Reference
Create a dynamic visualization of the square root function graph. Start with a numeric parameter, then define a composite function involving a power term and an exponential decay. Take its square root to obtain the target function. Use a random walk to generate a sequence of points, which are then rotated and transformed in 3D to trace the square root curve on the plane. Include the function curve, the random trajectory points, and text labels showing how function values change as the independent variable increases. The overall visual should combine function growth with randomness.
The prompt above was compiled from the original drawing commands and is for reference only.