
Square root function graphing example
Loading the math board and drawing, please wait…
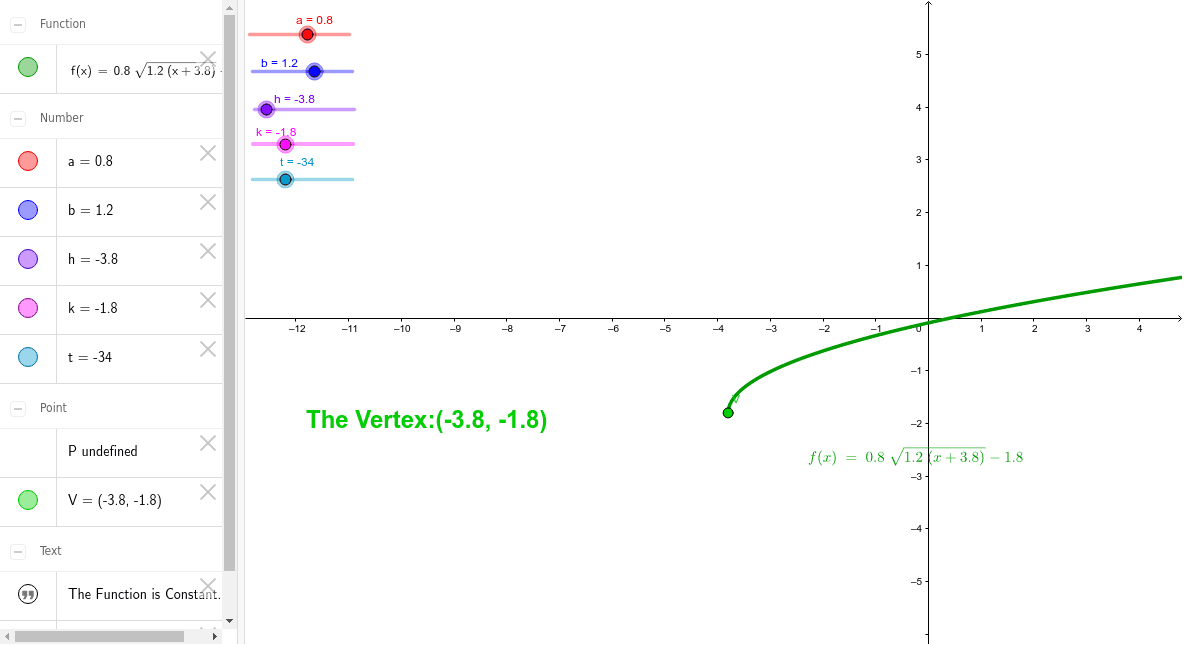
This example demonstrates the graphing of the square root function. Key mathematical concepts include function definition, image transformation, and coordinate system application. Construction involves using GeoGebra commands such as a, b, h, k, f, t, P, etc. for parameter setting and graph generation. Suitable for middle school students learning function image characteristics or for mathematical teaching tool development.
GeoGebra Commands & Parameters
Numeric a(0.8)Numeric b(1.2)Numeric h(-3.8)Numeric k(-1.8)f(x) = (a * sqrt((b * (x - h)))) + kNumeric t(-34.0)(t, (a * sqrt((b * (t - h)))) + k)(h, k)
AI Drawing Prompt Reference
Draw the graph of a square root function with adjustable parameters including a vertical stretch factor, a horizontal stretch factor, a horizontal shift, and a vertical shift. Set these parameters to specific values, then plot the curve. Mark a point on the curve at a given x-coordinate, showing its y-value. Also, plot the reference point at the coordinates of the horizontal and vertical shifts. Include coordinate axes, the function curve, the marked point, and the reference point to illustrate the transformation of the function graph.
The prompt above was compiled from the original drawing commands and is for reference only.