
Square Root Function by Luci Howard (2)
Loading the math board and drawing, please wait…
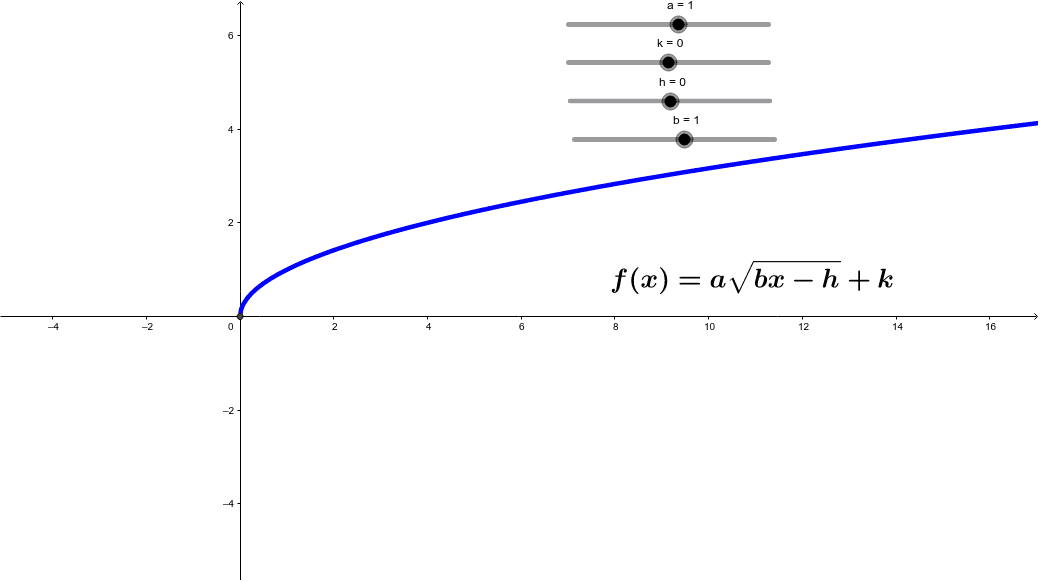
This example demonstrates the graph of a square root function. The core concepts include square root operations and function graphs. By adjusting parameters, you can observe changes in the function graph. This example uses GeoGebra objects such as a, k, h, b, b_1, c, and text1, suitable for high school mathematics education and learning.
GeoGebra Commands & Parameters
Numeric a(1.0)Numeric k(0.0)Numeric h(0.0)Numeric b(1.0)b_1(x) = x^(1 / 2)c(x) = (a * ((b * x) - h)^(1 / 2)) + k(h, k)
AI Drawing Prompt Reference
Draw the graph of a square root function, including a horizontal segment and a curve that changes with parameters. Start by plotting the basic square root function, then adjust parameters a, k, h, and b to observe changes in the curve. Parameter a scales the curve, k shifts it vertically, h shifts it horizontally, and b affects its shape. The final image should show the impact of these parameters on the function's graph.
The prompt above was compiled from the original drawing commands and is for reference only.