
Spinner Probability Investigation
Loading the math board and drawing, please wait…
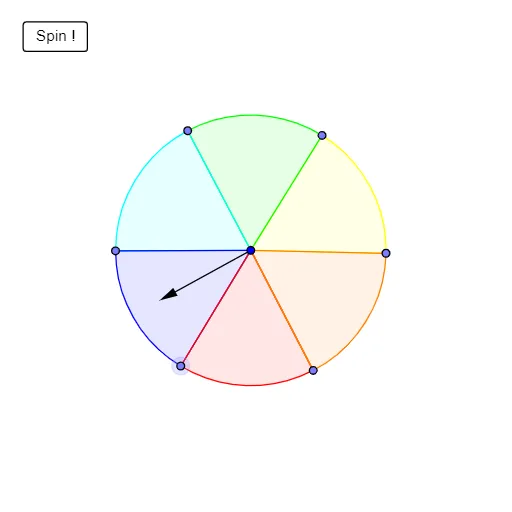
Investigate which color will appear the most using a spinner. Record your results and explain your thinking. This example covers probability concepts and is suitable for middle school and above students. It uses commands like RandomUniform, Vector, Circle, Point, and CircleSector in GeoGebra.
GeoGebra Commands & Parameters
RandomUniform(3600, 3960) → aVector(A) → uCircle((0, 0), 1.3) → dPoint(d) → BPoint(d) → CPoint(d) → DPoint(d) → EPoint(d) → FPoint(d) → GCircleSector(H, G, B) → eCircleSector(H, B, C) → fCircleSector(H, C, D) → gCircleSector(H, D, F) → hCircleSector(H, F, E) → kCircleSector(H, E, G) → p
AI Drawing Prompt Reference
Draw a spinner for probability investigation: create a circle centered at the origin with radius 1.3, place six points evenly on the circle, connect the center to each point to form six equal sectors, and fill each sector with a distinct color. Add a random number generator to simulate the spinner's stopping position, and show an arrow or pointer indicating a point on the circle. The overall graphic should clearly display the sectors and the random outcome for recording color frequencies.
The prompt above was compiled from the original drawing commands and is for reference only.