
Spherical Coordinates: Interactive 3D Visualization of Points on a Sphere
Loading the math board and drawing, please wait…
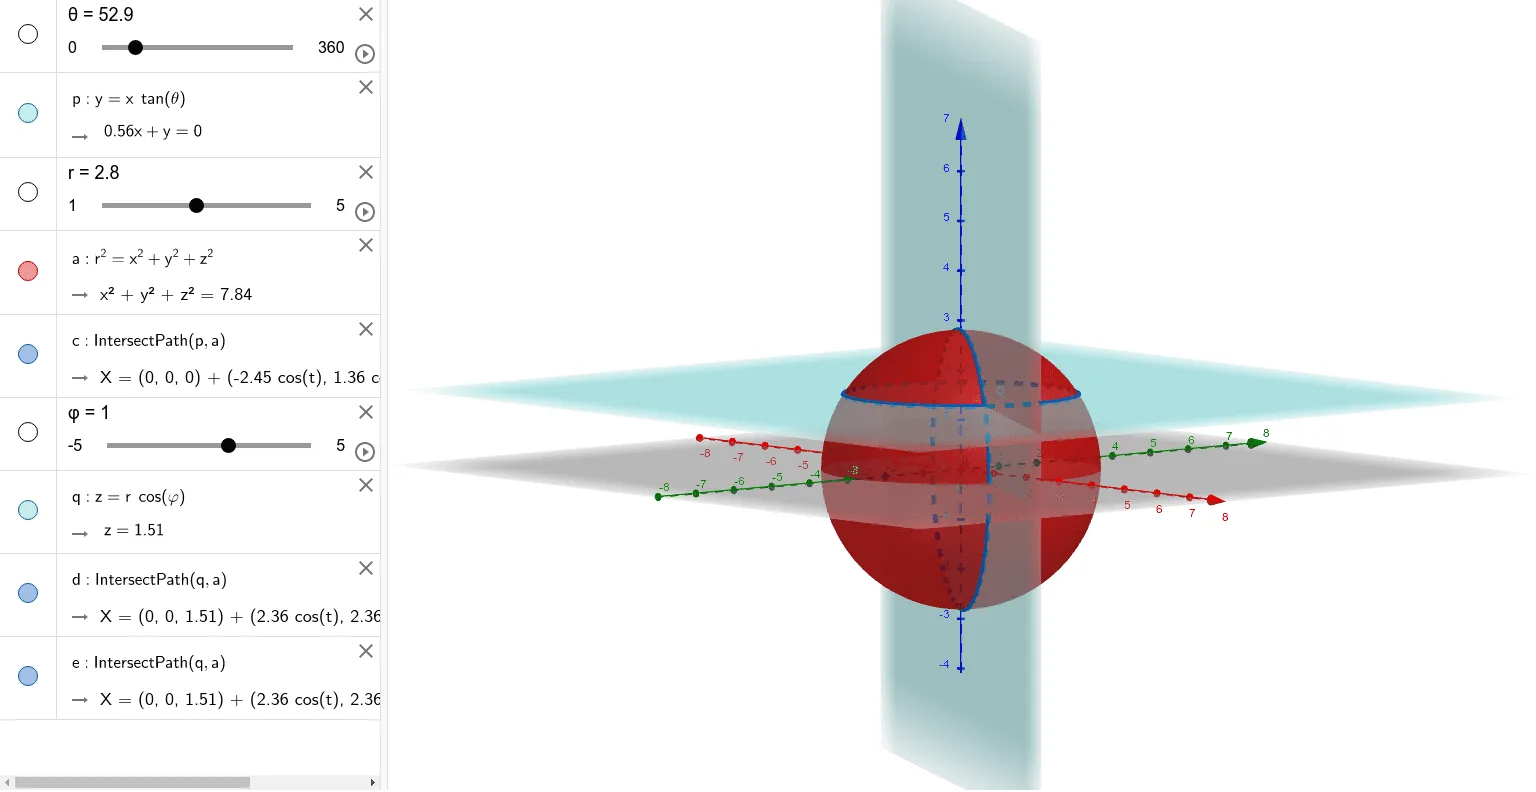
① This GeoGebra example dynamically demonstrates how a point in 3D space is determined by spherical coordinates (radius r, polar angle θ, and azimuthal angle φ), showing the point's position on a sphere as parameters change. ② Core mathematical concepts include conversion between spherical and Cartesian coordinates, sphere equations, parametric surfaces, and spatial point positioning, involving trigonometric functions and solid geometry. ③ Construction highlights: The model uses the GeoGebra command IntersectPath to generate intersection curves between the sphere and planes, with sliders controlling θ, φ, and r, and objects like p, q, d, e to build an interactive geometric setup that visualizes point movement and intersection paths. ④ Suitable for upper high school or early university students learning solid geometry, multivariable calculus, or physics applications of spherical coordinates, and for teachers to demonstrate coordinate transformations in class, enhancing students' 3D spatial reasoning.
GeoGebra Commands & Parameters
IntersectPath(p, a) → cIntersectPath(xOyPlane, q) →IntersectPath(q, a) → dIntersectPath(q, a) → e
AI Drawing Prompt Reference
Draw a sphere and dynamically show the position of a point on it, which is determined by radius r, polar angle θ, and azimuthal angle φ. Use sliders to control these parameters, and the point's position on the sphere changes as the sliders are adjusted. Also, display the intersection lines between the sphere and planes, including the intersection line between the sphere and the xOy plane, and the intersection lines d and e between the sphere and the plane passing through point q.
The prompt above was compiled from the original drawing commands and is for reference only.