
Speeding Car - Task
Loading the math board and drawing, please wait…
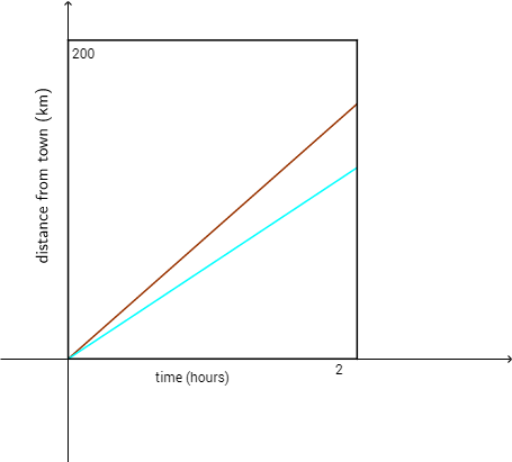
This example demonstrates the motion trajectory of a speeding car. Key mathematical concepts include functions and transformations. Using GeoGebra commands such as Polygon, RotateText, Textfield, and Point, dynamic geometric figures can be constructed. Suitable for high school math education or learning purposes.
GeoGebra Commands & Parameters
Polygon((0, 0), (0, 200), (2, 200), (2, 0)) → poly1, f, g, h, iRotateText("distance from town (km)", 90°) → text4Textfield(f_1) → InputBox1Textfield(f_2) → InputBox2Textfield(f_3) → InputBox3Textfield(f_4) → InputBox4Point(g_1) → A
AI Drawing Prompt Reference
Draw a diagram showing the motion trajectory of an accelerating car. Start with a vertical rectangle representing the coordinate area, with its bottom-left corner at the origin, width 2 units, and height 200 units. Add a rotated text label (90 degrees) reading 'distance from town (km)' near or inside the rectangle. Place four input boxes around the rectangle for entering or displaying values related to the motion. Finally, mark a point on or inside the rectangle to represent the car's current position or a point on its trajectory. The overall figure should clearly illustrate the relationship between distance and time or position.
The prompt above was compiled from the original drawing commands and is for reference only.