
Spearman's Rank Correlation Examples
Loading the math board and drawing, please wait…
In collections
Randomised Questions
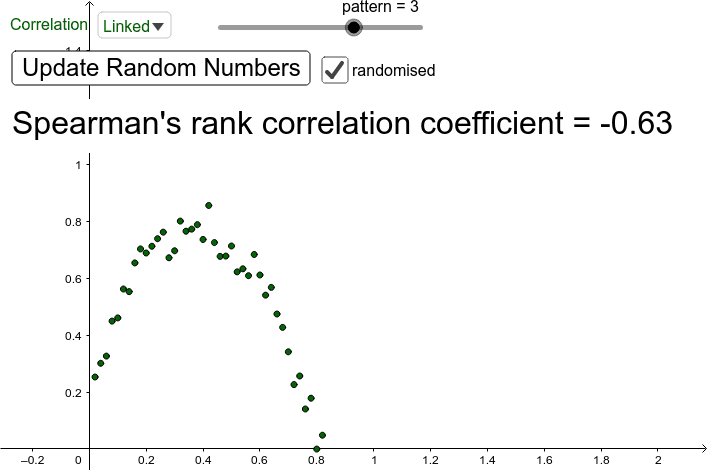
This example demonstrates how to visualize Spearman's Rank Correlation Coefficient using GeoGebra, covering core concepts like correlation calculation, data sorting, vector addition, trigonometry, and variance. Key GeoGebra commands and objects used include Sequence, Sort, If, Element, and Spearman, along with elements like listX, listY, and points. Ideal for high school and above, focusing on statistical data visualization and correlation analysis.
GeoGebra Commands & Parameters
Sequence(i / n, i, 1, n) → uniformXSequence(random(), i, 1, n) → randomYSort(Sequence[random(), i, 1, n]) → randomXIf(SelectedIndex[type] ≟ 1, randomX, uniformX) → listXElement(list1, pattern) → pSequence(p(Element[listX, i]) + (c * (random() - 0.5) / 6), i, 1, n) → linkedYIf(SelectedIndex[type] ≟ 1, randomY, linkedY) → listYSequence((Element[listX, i], Element[listY, i]), i, 1, n) → pointsSpearman(points) → a
AI Drawing Prompt Reference
Create two sets of data points, one uniformly distributed and one randomly distributed then sorted, transform the sorted random data linearly to generate a third set, mix all three sets to form a scatter plot, and finally calculate and display the Spearman rank correlation coefficient for these two sets of data points.
The prompt above was compiled from the original drawing commands and is for reference only.