
Solving Linear Systems by Graphing: Dynamic Intersection Demo
Loading the math board and drawing, please wait…
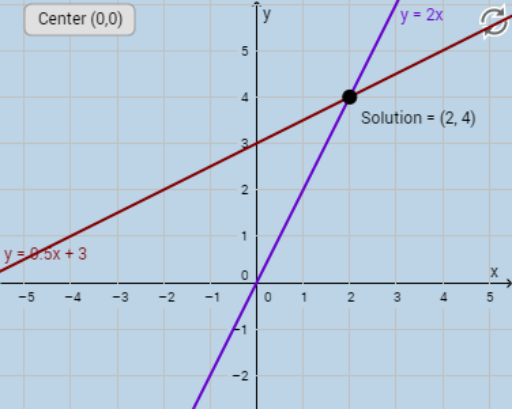
① This example demonstrates how to solve a system of linear equations by graphing two lines and observing their intersection point, which represents the solution. ② Core math concepts include linear functions, slope-intercept form, systems of equations, and the geometric interpretation of unique, no, or infinite solutions. ③ Construction highlights: uses GeoGebra's Intersect command to find the intersection, FractionText to display coordinates as fractions, Textfield and InputBox for editable equation inputs, button1 to trigger updates, Point objects to mark the solution, and text objects for labels. ④ Suitable for middle school to high school students learning linear equations and systems, as well as teachers for interactive classroom demonstrations, bridging algebraic and geometric reasoning.
GeoGebra Commands & Parameters
Intersect(g, i) → SolutionFractionText(x(Solution)) → text1FractionText(y(Solution)) → text2Textfield(g) → InputBox1Textfield(i) → InputBox2Intersect(i, xAxis) → APoint(i) → BPoint(g) → CPoint(g) → D
AI Drawing Prompt Reference
Draw two lines, show their intersection point as the solution, label the coordinates of the intersection as fractions, provide input boxes for editing the equations of the lines, use a button to control updates, mark the intersection and the starting points of the lines with points, and add text labels to explain the elements of the graph.
The prompt above was compiled from the original drawing commands and is for reference only.