
Solving Linear Equations Graphically & Symbolically
Loading the math board and drawing, please wait…
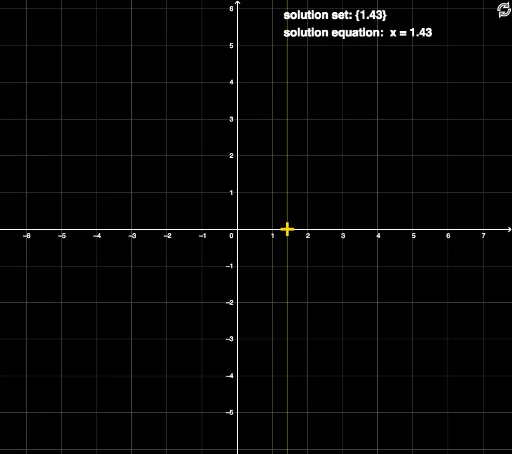
This GeoGebra example demonstrates how to solve linear equations both graphically and symbolically, showing that the solution corresponds to the intersection point of two lines or the x-intercept of a function. Core mathematical concepts include linear equations, linear functions, roots, intersection coordinates, and symbolic algebra manipulation. The construction uses GeoGebra commands such as Intersect to find the crossing point of lines, Point to mark key locations, and Polynomial to define function expressions. Sliders and parameters like m, b, M, B allow dynamic adjustment of the lines, while text objects display the symbolic solution alongside the graphical representation. This resource is suitable for middle and high school students learning the connection between equations and graphs, and for teachers demonstrating the equivalence of algebraic and geometric solutions, fostering a strong number-sense and visual understanding of linear relationships.
GeoGebra Commands & Parameters
Intersect(g, f) → CPoint(yAxis) → DPoint(yAxis) → EPoint(c) → FPolynomial({D, F}) → hPolynomial({E, F}) → p
AI Drawing Prompt Reference
Draw two lines and their intersection point, mark two points on the y-axis, define two more lines using these points and the intersection point, display all lines graphically, label the coordinates of the intersection point, and use text to show the equations of the lines and the coordinates of the intersection point, with sliders to adjust the slopes and intercepts of the lines.
The prompt above was compiled from the original drawing commands and is for reference only.