
Solving Absolute Value Inequalities (Less Than)
Loading the math board and drawing, please wait…
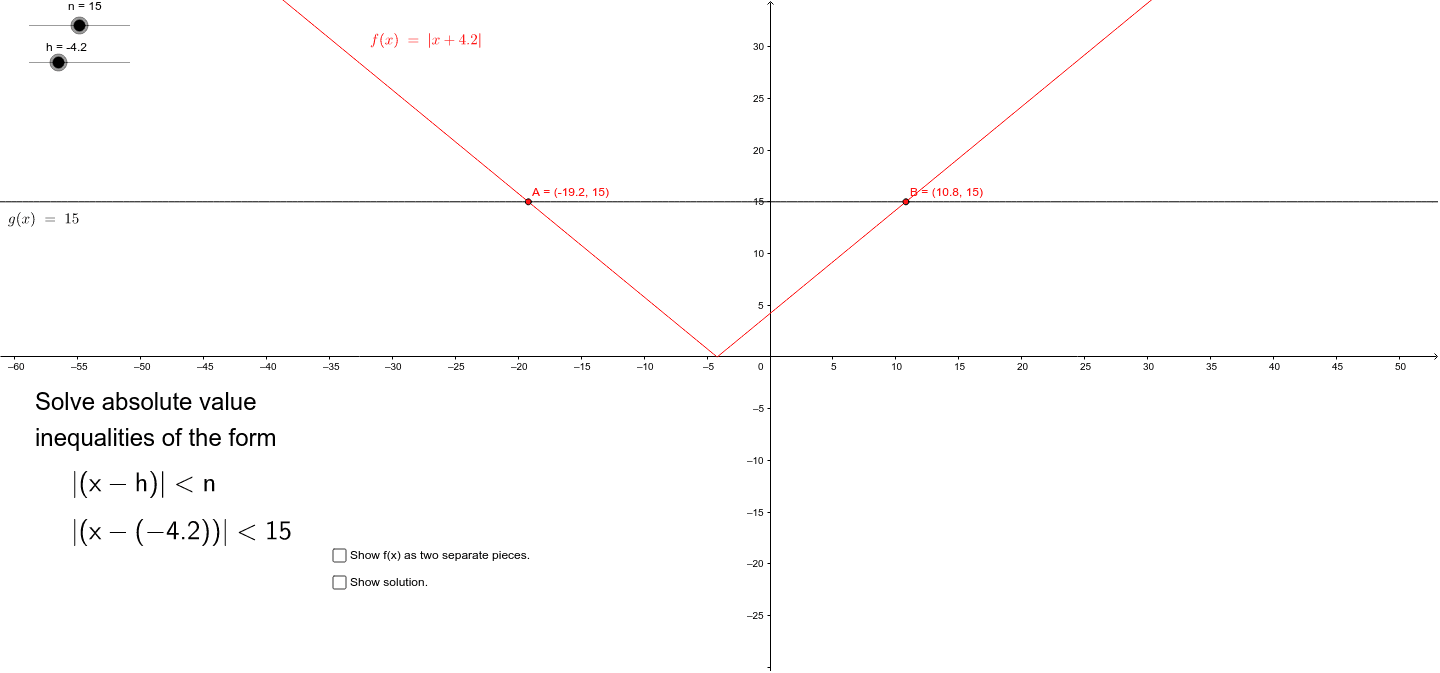
This example demonstrates solving absolute value inequalities through guided exploration. It involves core math concepts like solving absolute value inequalities and their geometric representation. Construction highlights include using GeoGebra commands such as Function, LaTeX, Intersect, and objects like h, n, g, f, text1_1, text4, text8, text1_2, text1_3, f1, f2, text1, text2, A, B, a, S1, S2, i1, i2, b, text5, text8_3. Suitable for middle school and above students to understand the graphical solution set of absolute value inequalities in the coordinate system.
GeoGebra Commands & Parameters
Function(-(x - h), -1000, h) → f1Function(x - h, h, 1000) → f2LaTeX(f1, true, true) → text1LaTeX(f2, true, true) → text2Intersect(g, f, (-19.2, 15)) → AIntersect(g, f, (10.8, 15)) → BFunction(f1, S1, h) → i1Function(f2, h, S2) → i2
AI Drawing Prompt Reference
Draw the graphical solution set of an absolute value inequality in a coordinate system by first plotting two symmetric functions about the x-axis, then finding their intersections with the x-axis, connecting these intersection points with a horizontal line segment, and labeling the equations of the functions below the graph and marking the intersection points.
The prompt above was compiled from the original drawing commands and is for reference only.