
Graphical representation of the derivative of y = sinx
Loading the math board and drawing, please wait…
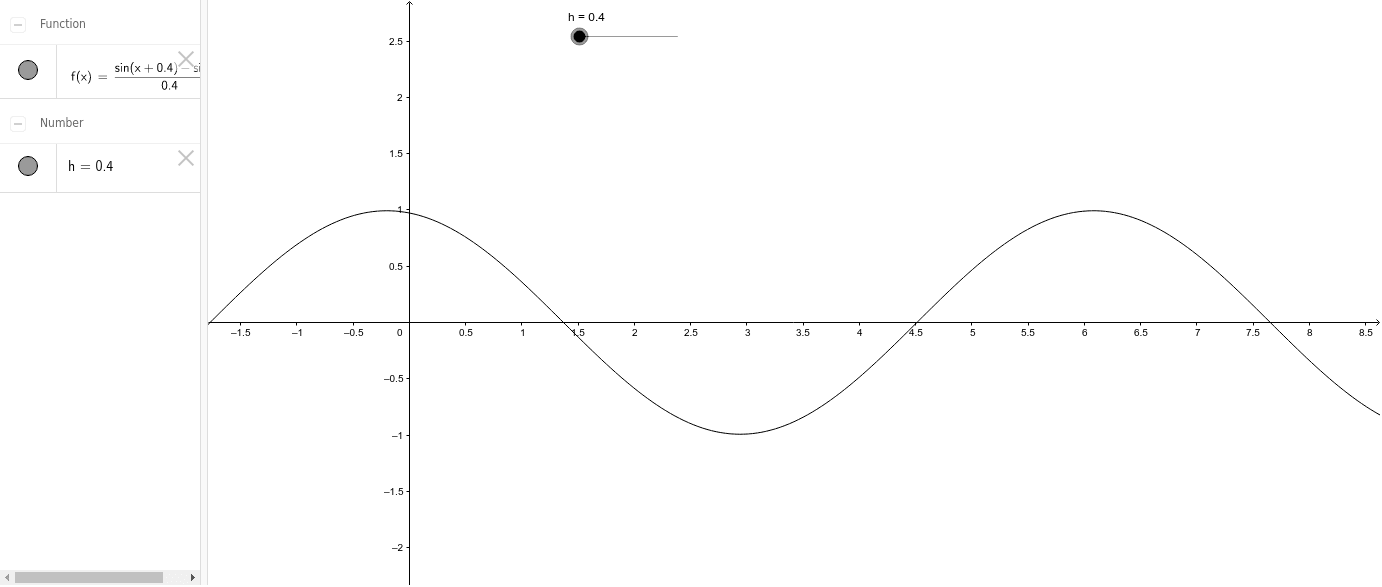
This GeoGebra example enables students to explore the graphical representation of the derivative of y = sinx using its formal definition. The interactive construction illustrates the derivative as the slope of the tangent line to the sine curve at various points, linking the limit of secant slopes to the actual tangent. Key objects, such as the auxiliary segment h and the function f, are used to construct and animate the tangent line, demonstrating how the derivative value changes continuously along the curve. It is suitable for high school calculus courses or introductory college-level mathematics, helping learners transition from geometric intuition to analytical computation of derivatives for trigonometric functions.
GeoGebra Commands & Parameters
Numeric h(0.4)f(x) = (sin(x + h) - sin(x)) / h