
Smartboard Dartboard (Coordinates)
Loading the math board and drawing, please wait…
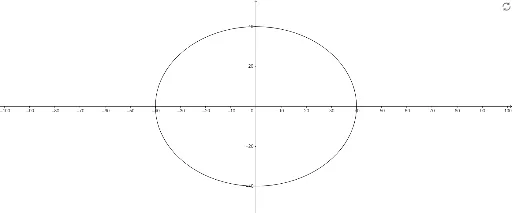
This example demonstrates a coordinate-based dartboard, showcasing data distribution through coordinate points. It involves core math concepts like coordinate geometry, isosceles triangles, histograms, power functions, percentages, and differential calculus. Constructed using GeoGebra commands like Zip, Append, Circle, TableText, and objects such as buttonRegister and buttonUnregister. Suitable for high school mathematics teaching, focusing on coordinate geometry applications and data analysis.
GeoGebra Commands & Parameters
Zip(Object[N], N, AllPointNames) → AllPointValuesZip(x(N), N, AllPointValues) → xCoordsZip(y(N), N, AllPointValues) → yCoordsZip(sqrt(N^(2) + M^(2)), N, xCoords, M, yCoords) → L_1Zip(100 - (2.5 * N), N, L_1) → L_2Append("Point", AllPointNames) → L_3Append("Distance", L_1) → L_4Append("Score", L_2) → L_5Circle((0, 0), 40) → cZip(Text[(N, M)], N, xCoords, M, yCoords) → l1Append("Coordinates", l1) → L_8TableText({L_3, L_8}, "|_vc") → text1