
Slope with No Numbers: Visualizing Line Inclination
Loading the math board and drawing, please wait…
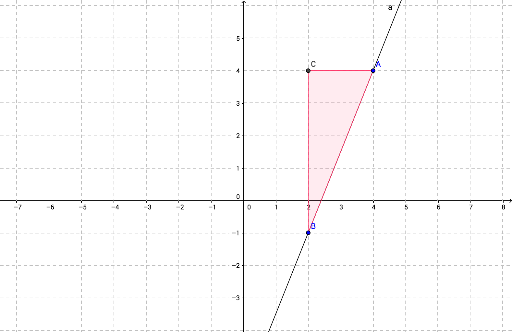
① This interactive GeoGebra example demonstrates the concept of slope of a line purely visually, without relying on numerical values, allowing learners to grasp that slope is the ratio of rise to run. ② Core mathematical concepts include slope (rise/run), right triangle construction, perpendicular lines, intersections, and polygon areas. ③ Construction details: using GeoGebra commands Line, OrthogonalLine, Intersect, and Polygon, with objects A, B, a, b, c, C, poly1, and variables rise, run, slope to dynamically link geometric elements to the slope value. ④ Suitable for middle school to high school students first encountering slope, and useful for teachers as a visual demonstration tool to bridge geometric intuition and algebraic representation.
GeoGebra Commands & Parameters
Line(A, B) → aOrthogonalLine(A, yAxis) → bOrthogonalLine(B, xAxis) → cIntersect(b, c) → CPolygon(A, C, B) → poly1, b_1, a_1, c_1
AI Drawing Prompt Reference
Draw a straight line and construct two perpendicular coordinate axes intersecting it. Mark the intersection points. Form a triangle using the line and the two axes. Then complete the triangle into a quadrilateral, dynamically showing the relationship between the quadrilateral and the original triangle to visually represent the line's inclination and key geometric elements.
The prompt above was compiled from the original drawing commands and is for reference only.