
Slope Quiz (2)
Loading the math board and drawing, please wait…
In collections
Introduction to Linear Functions and Graphs
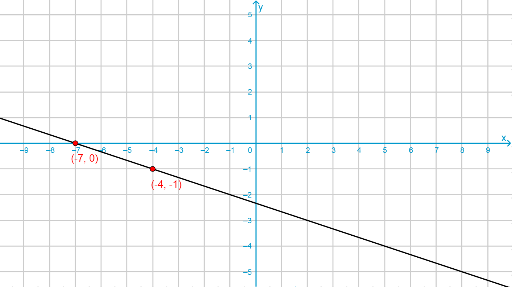
This quiz uses dynamic geometry to help students understand the concept of slope. It involves key mathematical concepts such as the slope of a line, vectors, and right triangles. Using GeoGebra commands like Sequence, Line, and Point, students can observe the changes in slope dynamically. Suitable for middle school and above students for learning and practice.
GeoGebra Commands & Parameters
Max({maxX - minX, maxY - minY}) → maxAppend("?", Sequence[Text[(-i)], i, (-max), max]) → listTextYAppend("?", Sequence[Text[(-i)], i, (-max), max]) → listTextXSequence((-i), i, (-max), max) → listXElement(listX, SelectedIndex[listTextX] - 1) → xSelectedSequence((-i), i, (-max), max) → listYElement(listY, SelectedIndex[listTextY] - 1) → ySelectedShuffle(Sequence[i, i, minX, maxX]) → xListElement(xList, 1) → a_1Element(xList, 2) → a_2Random(minY, maxY) → b_2Random(minY, maxY) → b_1Line(P, Q) → LPoint(L) → APoint(L) → BPolygon(A, B, If[x(B) > x(A), (x(B), y(A)), (x(A), y(B))]) → slope, a, b, cSequence(Translate[slope, Vector[(i * Vector[A, B])]], i, -20, 20) → listSlope
AI Drawing Prompt Reference
In a coordinate system, dynamically display a line segment and multiple parallel line segments, connecting two random points and labeling the slope of each line segment, while numbering each segment below to observe how the slope changes with the position of the line segments.
The prompt above was compiled from the original drawing commands and is for reference only.