
Slope of a Parabola: Visualizing Tangent and Secant Slopes
Loading the math board and drawing, please wait…
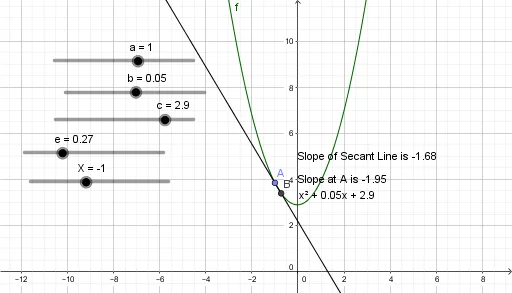
This GeoGebra example dynamically illustrates the slope of a parabola at any point, showing how the secant slope approaches the tangent slope. The core mathematical concepts include quadratic functions, derivatives, tangent lines, and the limit idea. Construction highlights: the Line command creates secant and tangent lines, while the Slope command measures and displays their slopes. Key objects include the parabola f, moving point A, tangent point B, secant line d, tangent line e, and text objects text1, text2, text3 for labeling slope values and explanations. Suitable for high school calculus introduction or pre-university levels, this interactive tool helps students grasp the geometric meaning of derivatives. By dragging points A or B, learners observe slope changes and transition from average rate of change to instantaneous rate of change, making it ideal for classroom demonstrations or self-study.
GeoGebra Commands & Parameters
Line(A, B) → gSlope(g) → h