
Slope Investigation - Parabola
Loading the math board and drawing, please wait…
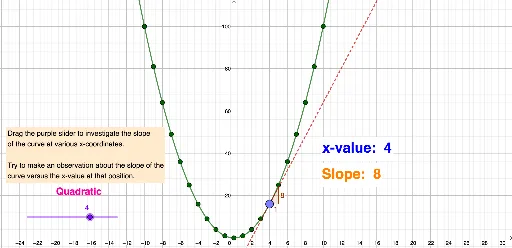
This example demonstrates the investigation of slope variation at points on a parabola's graph. Key math concepts include derivatives, function graphs, and slope calculation. GeoGebra commands and objects used are Sequence, Tangent, and Slope. Suitable for high school mathematics teaching to understand the geometric meaning of derivatives and explore local properties of functions.
GeoGebra Commands & Parameters
Sequence((k, f(k)), k, -10, 10) → L_1Tangent(A, f) → gSlope(g) → a
AI Drawing Prompt Reference
Draw a parabola and a series of discrete points on it, evenly spaced at integer x-coordinates from -10 to 10. At one of these points, construct a tangent line to the parabola and display the slope value of this tangent. The overall graph is used to observe how the slope of the tangent changes at different positions on the parabola, illustrating the geometric meaning of the derivative. The image should include the function curve, the discrete points, one tangent line, and the labeled slope value.
The prompt above was compiled from the original drawing commands and is for reference only.