
Slope Intercept Form (Table, Graph, Equation)
Loading the math board and drawing, please wait…
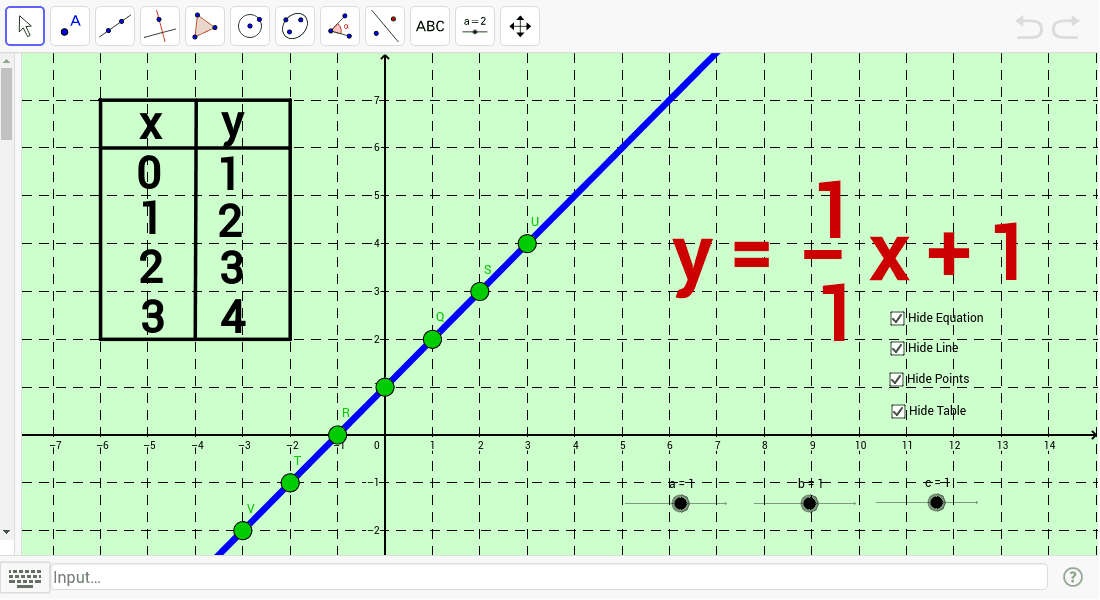
Move sliders to change the parts of the line and observe the corresponding changes in the equation, line, points, and table. This example demonstrates the slope intercept form of a line and involves key concepts of linear equations. It uses GeoGebra commands such as Segment and Point for construction. Suitable for middle school and above students to learn about linear equations and function graphs.
GeoGebra Commands & Parameters
Segment(B, A) → hSegment(E, F) → jSegment(F, G) → kSegment(G, H) → lSegment(H, E) → mPoint(m) → IPoint(k) → JSegment(I, J) → i
AI Drawing Prompt Reference
Draw a coordinate system with a line and two sliders. The sliders control the intercept and slope of the line. The line passes through two points, one on the x-axis and one on the y-axis, both related to the sliders. Display the equation of the line and a table showing several points on the line.
The prompt above was compiled from the original drawing commands and is for reference only.