
Slope-Intercept Form Demo
Loading the math board and drawing, please wait…
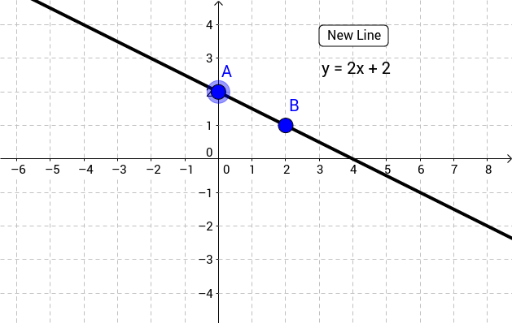
This example demonstrates how to graph a line using the slope-intercept form y = mx + b, showcasing the relationship between slope m and y-intercept b. Core math concepts include slope, y-intercept, linear functions, and the equation of a line. Construction highlights: the GeoGebra command Line is used to draw the line, while objects a, button1, text1, A, B, b, text2 are employed for parameter control and labeling. Suitable for middle school and above students learning linear equations, understanding the impact of slope and intercept on line graphs, and function graphing instruction.
GeoGebra Commands & Parameters
Line(A, B) → b
AI Drawing Prompt Reference
Draw a line using the slope-intercept form y = mx + b. Adjust the slope m and y-intercept b by moving points A and B. First create points A and B, then use the line tool to connect them and form the line.
The prompt above was compiled from the original drawing commands and is for reference only.