
Slope Fields Visualization for Differential Equations
Loading the math board and drawing, please wait…
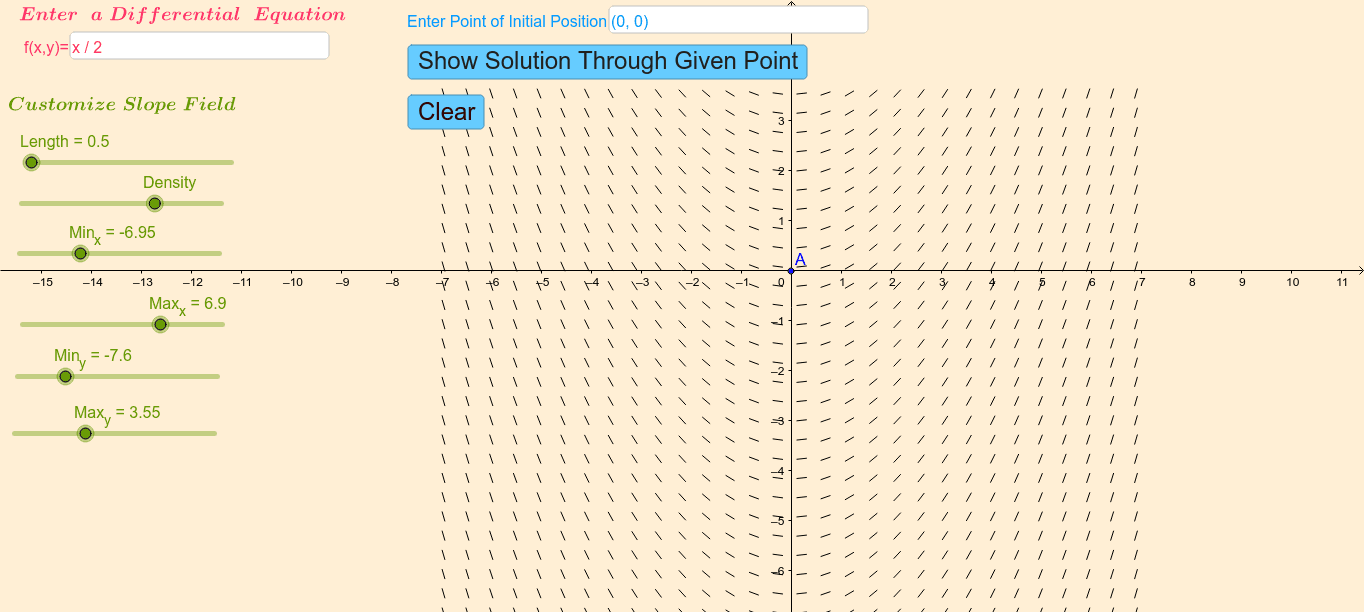
This interactive GeoGebra applet visualizes slope fields for first-order differential equations. It illustrates the relationship between a differential equation and its solution curves. Core concepts include calculus, derivatives, and direction fields. Construction utilizes the SlopeField command, InputBox for defining the function f, sliders for adjusting density and viewing window, and buttons for control. Ideal for students learning differential equations in calculus courses.
GeoGebra Commands & Parameters
Textfield(f) → InputBox1SlopeField(f(x, y), Density, Length, Min_x, Min_y, Max_x, Max_y) → slopefield1Textfield(A) → InputBox2
AI Drawing Prompt Reference
Draw a slope field graph to visualize a first-order differential equation. The graph should include slope lines, arrows indicating direction, and an input box for defining the function. Density and viewing window can be adjusted using sliders. The overall graph should clearly show the relationship between the differential equation and solution curves, suitable for a calculus course on differential equations.
The prompt above was compiled from the original drawing commands and is for reference only.