
Skittles Statistics
Loading the math board and drawing, please wait…
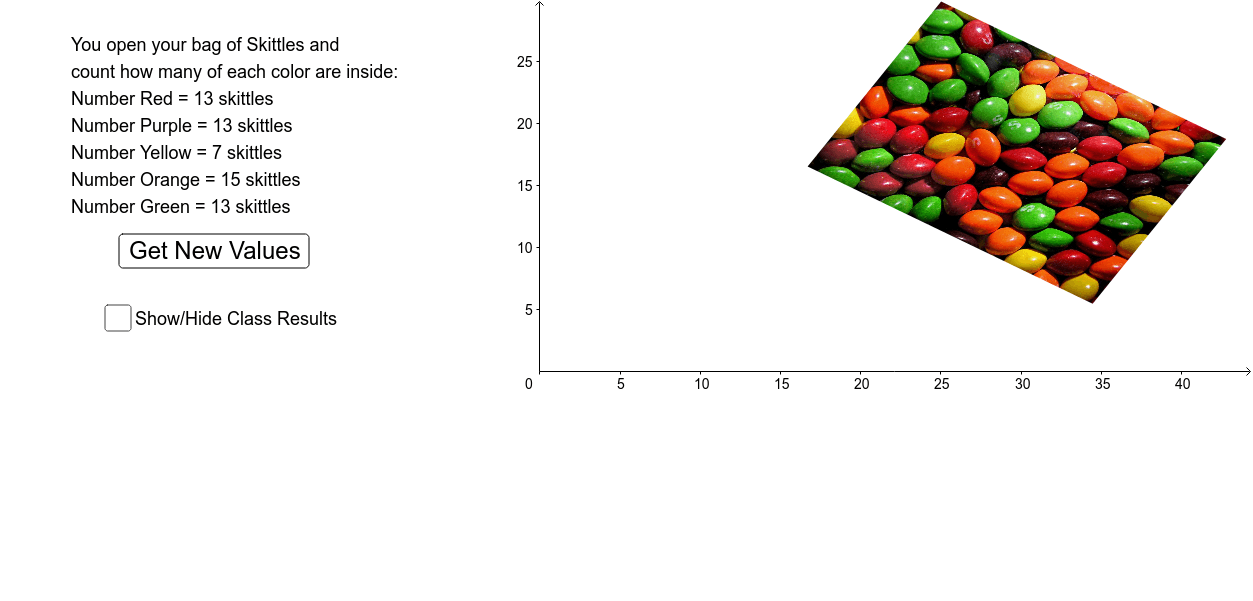
This example demonstrates statistics for a single bag of Skittles and 100 bags of Skittles. It involves core concepts of probability and statistics such as mean and standard deviation. Using GeoGebra commands like Sequence and BarChart, it visually represents data distribution. Suitable for middle school and above students to learn probability and statistics.
GeoGebra Commands & Parameters
Sequence(round(RandomNormal[indMean, indStd]), i, 1, 100) → redListSequence(round(RandomNormal[indMean, indStd]), i, 1, 100) → purpleListSequence(round(RandomNormal[indMean, indStd]), i, 1, 100) → greenListSequence(round(RandomNormal[indMean, indStd]), i, 1, 100) → orangeListSequence(round(RandomNormal[indMean, indStd]), i, 1, 100) → yellowListBarChart(redList, 1) → c