
Sketch the Derivative Function
Loading the math board and drawing, please wait…
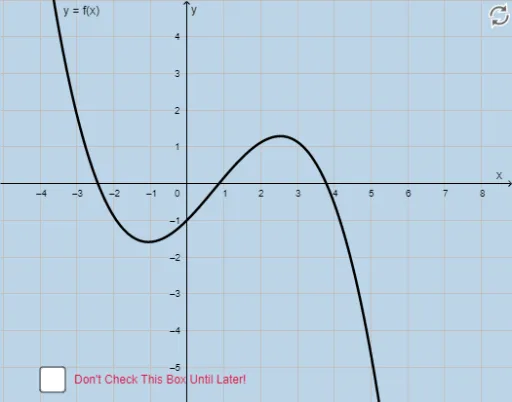
This example guides students to sketch the derivative function of a given function through an intuitive exercise. Key mathematical concepts include derivatives and function graphs. Using GeoGebra commands f, g, a, students can understand the relationship between the derivative and the original function. Suitable for high school math education, helping students grasp the concept of derivatives and their geometric meaning.
GeoGebra Commands & Parameters
f(x) = (-1 / 8 * (x + 1.3923795272694095)^(3)) + (0.8 * (x + 1.3923795272694095)^(2)) - ((0.5 * (x + 1.3923795272694095)) + 1.5097050891378743)g(x) = f'(x)Boolean a(false)
AI Drawing Prompt Reference
Draw the graph of a cubic polynomial function that has been shifted and scaled, showing a wave-like curve with a local maximum and minimum. Also plot its derivative, which is a quadratic function whose zeros correspond to the extrema of the original function. Use a solid line for the original function and a dashed or differently colored line for the derivative. Include a toggle switch initially set to off, which controls the visibility of the derivative graph. The overall layout should clearly illustrate the geometric relationship between the function and its derivative to aid understanding of calculus concepts.
The prompt above was compiled from the original drawing commands and is for reference only.