
Sine, Tangent, Cosine Order to 360
Loading the math board and drawing, please wait…
In collections
Sine and Cosine Functions
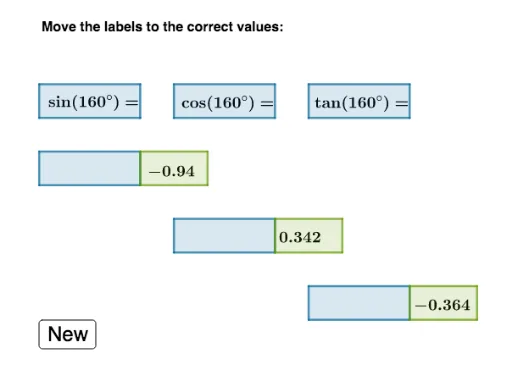
This example demonstrates the changes of sine, tangent, and cosine functions within a 360-degree range. Key mathematical concepts include trigonometric functions and geometric transformations. Using GeoGebra commands such as Shuffle, Element, and Polygon, it dynamically illustrates the periodicity and symmetry of these functions. Suitable for high school mathematics education and learning.
GeoGebra Commands & Parameters
Shuffle(list1) → list2Element(list2, 1) → pElement(list2, 2) → qElement(list2, 3) → rPolygon(A, B, C, D) → q1, a_1, b_1, c_1, dPolygon(E, F, G, H) → q2, e, f, g, hPolygon(I, J, K, L) → q3, i, j, k, lPolygon(M, N, O, P) → q4, m, n, o, p_1Polygon(Q, R, S, T) → q5, q_1, r_1, s, tPolygon(U, V, W, Z) → q6, u, v, w, z_1Polygon(N, A_1, B_1, C_1) → q7, n_1, a_2, b_2, c_2Polygon(F_1, G_1, S, T) → q9, f_1, g_1, s_1, t_1Point(xAxis) → I_1Polygon(Z, W, H_1, I_1) → q10, z_2, w_1, h_1, i_1Centroid(q1) → D_1Centroid(q2) → E_1Centroid(q3) → J_1IsInRegion(D_1, q4) → da_1IsInRegion(D_1, q5) → db_1IsInRegion(D_1, q6) → dc_1IsInRegion(E_1, q4) → ea_1IsInRegion(E_1, q5) → eb_1IsInRegion(J_1, q4) → ja_1IsInRegion(J_1, q5) → jb_1IsInRegion(J_1, q6) → jc_1IsInRegion(E_1, q6) → ec_1
AI Drawing Prompt Reference
Draw a graph showing the changes of sine, tangent, and cosine functions within a 360-degree range, including multiple polygons and points, to dynamically illustrate the periodicity and symmetry of these functions, start by randomly arranging three function values, then represent them with polygons and points, calculate the centroids of the polygons, and finally determine if the centroids are in specific regions, distinguishing them with different colors or styles.
The prompt above was compiled from the original drawing commands and is for reference only.