
Sine Functions and Their Inverses: Graphical Relationship
Loading the math board and drawing, please wait…
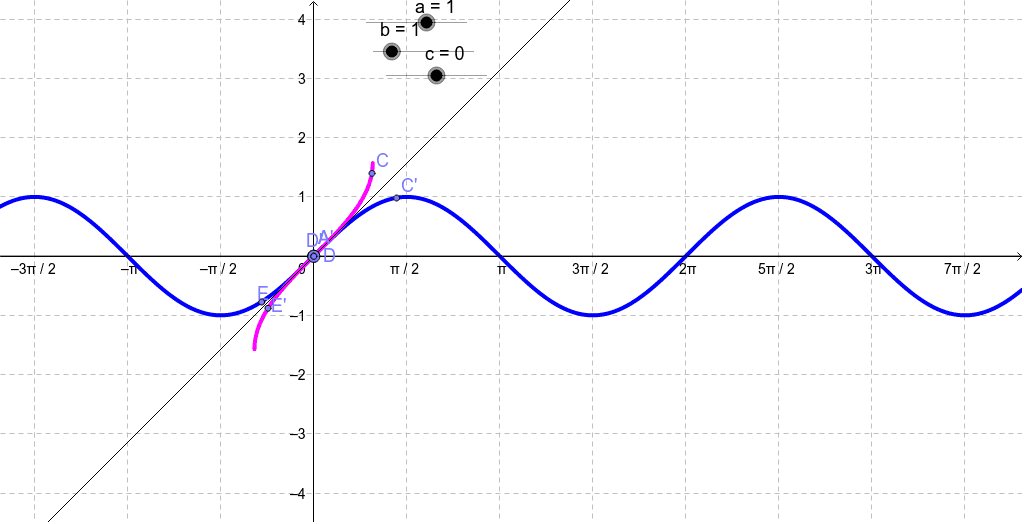
This GeoGebra example dynamically illustrates the relationship between the graphs of sine functions and their inverse functions (arcsine). It demonstrates how the sine curve, restricted to a suitable domain, reflects across the line y=x to produce the inverse graph. Core mathematical concepts include domain, range, monotonicity, and the symmetry property of inverse functions. The construction uses GeoGebra commands such as Point and Mirror, along with objects like curves a, b, c, d, e, f, g, h, i, p, q, r, s, and points A, B, C, D, E with their mirrored counterparts A', C', D', E'. This resource is ideal for high school or introductory college students learning trigonometry and inverse functions, and serves as an interactive visual aid for teachers explaining the reflection property of inverse graphs.
GeoGebra Commands & Parameters
Point(g) → AMirror(A, h) → A'Point(g) → CMirror(C, h) → C'Point(g) → DMirror(D, h) → D'Point(g) → EMirror(E, h) → E'
AI Drawing Prompt Reference
Draw the graph of a sine function and its inverse. Start by plotting the sine curve on the x-axis, then select several points on the curve and reflect them across the line y=x to obtain the inverse function's graph.
The prompt above was compiled from the original drawing commands and is for reference only.