
Graph of Inverse Sine Function
Loading the math board and drawing, please wait…
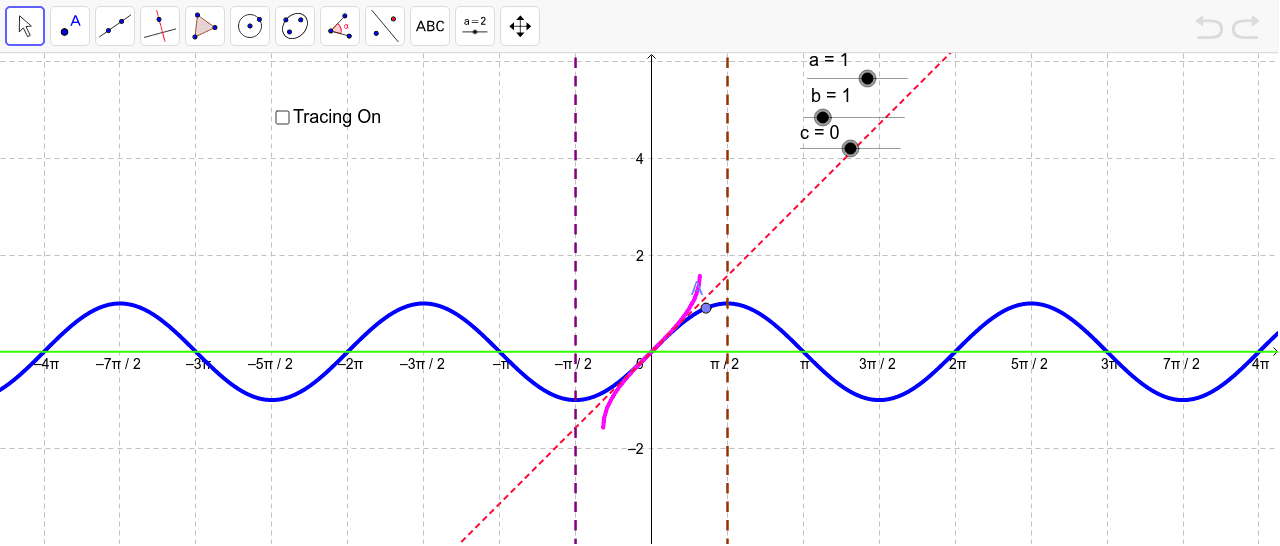
This example demonstrates the relationship between the sine function and its inverse using slider animations and tracing features. The sine function is a fundamental trigonometric concept involving periodicity, amplitude, and phase shifts. Construction involves GeoGebra commands like Point and Mirror to create function graphs and inverse graphs. Suitable for high school students or math enthusiasts to understand function properties and transformations.
GeoGebra Commands & Parameters
Point(g) → A_1Mirror(A_1, h) → A'_1Point(g) → CMirror(C, h) → C'Point(g) → DMirror(D, h) → D'Point(g) → EMirror(E, h) → E'Point(r_1) → FMirror(F, h) → F'Point(q_1) → GPoint(f) → AMirror(A, h) → A'
AI Drawing Prompt Reference
Draw a graph of the sine function and its inverse. The sine curve shows a wave pattern, while the inverse curve appears reversed. Use a slider to dynamically adjust parameters like amplitude and period. The two curves should intersect at certain points. Ensure the graph is clear and labeled to help understand the function relationship.
The prompt above was compiled from the original drawing commands and is for reference only.