
Sine Function Transformations by geekyteacheruk
Loading the math board and drawing, please wait…
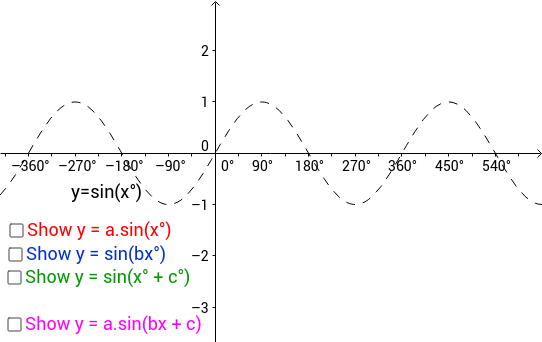
This example demonstrates the geometric transformations of the sine function and its graph variations. It involves core math concepts like trigonometry, geometric transformations, quadratic functions, polynomial functions, circles, and hypothesis testing. GeoGebra commands and objects used include a, f, g, a_1, c_1, c, h, text2, text1, b, b_1, p, text3, d_1, q, text4_1. Suitable for high school students and educators to understand function transformations and graphing techniques.
GeoGebra Commands & Parameters
Numeric a(1.0)f(x) = sin(x°)g(x) = a * sin(x°)Boolean a_1(false)Boolean c_1(false)Numeric c(0.0)h(x) = sin(x° + c°)Numeric b(1.0)Boolean b_1(false)p(x) = sin((b * x)°)Boolean d_1(false)q(x) = a * sin((b * x)° + c°)
AI Drawing Prompt Reference
Draw a sine function graph to demonstrate geometric transformations. Start with the basic sine curve, then adjust the amplitude parameter a to show the effect of amplitude changes on the graph. Next, use the phase shift parameter c to illustrate the effect of phase transformation. Finally, combine the amplitude and phase shift parameters to draw the composite transformed sine curve, labeling key parameters and curve names to observe and understand the function transformation patterns.
The prompt above was compiled from the original drawing commands and is for reference only.