
Sine Function Demonstration by Jiří Vančura
Loading the math board and drawing, please wait…
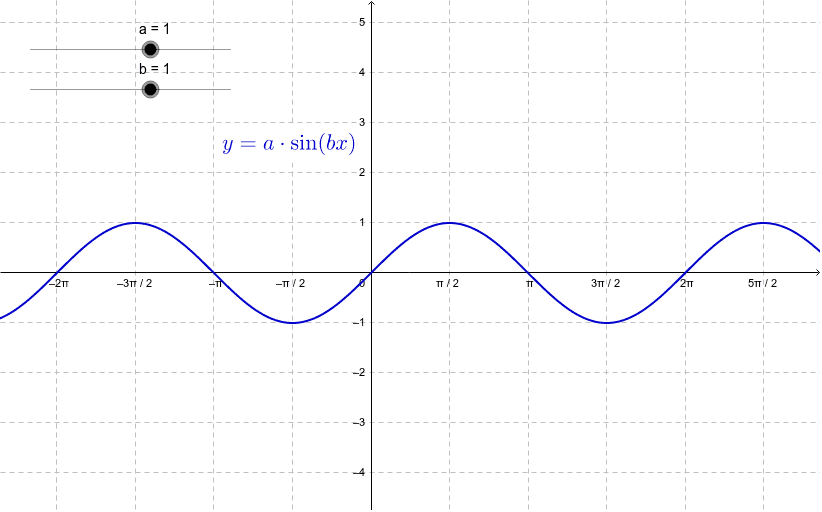
This example demonstrates the sine function graph and its representation in right-angled triangles. It involves core math concepts like sine value, trigonometric functions, right triangles, and function graphs. Construction uses GeoGebra objects: points a, b, c, d, text1, and function f. Suitable for high school students learning basic properties and applications of trigonometric functions.
GeoGebra Commands & Parameters
Numeric a(1.0)Numeric b(1.0)Numeric c(1.3)Numeric d(1.4)f(x) = a * sin(b * x)
AI Drawing Prompt Reference
Draw a sine function graph and demonstrate its relation to right-angled triangles. Construct a right triangle using segments of lengths 1.0, 1.0, and 1.3, then extend it with a segment of length 1.4. The sine function graph should be generated based on these lengths, with key points labeled to clearly show the correspondence between the sine value and the sides of the right triangle.
The prompt above was compiled from the original drawing commands and is for reference only.