
Draw a Bottle, Get a Graph: Exploring Functions from Bottle Shapes
Loading the math board and drawing, please wait…
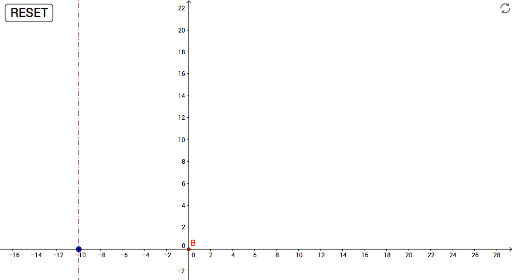
① This example demonstrates how drawing a bottle outline and applying geometric operations like mirroring and line construction leads to a corresponding function graph, visually linking a physical shape to its mathematical representation. ② Core math concepts include function graphs, polynomial functions, volume, prisms, sequences and series, pie/circle charts, and step functions, bridging 2D shapes with 3D volume intuition. ③ Construction highlights: using GeoGebra commands Mirror, Line, Intersect, and Segment, with objects V (volume), h0 (initial height), button1 (interactive button), f (function), points A, A', A'' (and their mirrors), g, h (auxiliary lines/functions), B, C (intersection points), and i (segment/curve). An interactive button allows dynamic parameter adjustment, showing how the graph changes with the bottle's shape. ④ Suitable for high school and above, this serves as a cross-disciplinary teaching tool for functions and geometry, ideal for mathematical modeling or project-based learning, helping students understand how function graphs arise from real objects and explore relationships between volume and functions.
GeoGebra Commands & Parameters
Mirror(A, f) → A'Mirror(A', f) → A''Line(A, xAxis) → gIntersect(g, h) → BIntersect(h, xAxis) → CSegment(C, B) → i