
Sine Function by Markus Hohenwarter
Loading the math board and drawing, please wait…
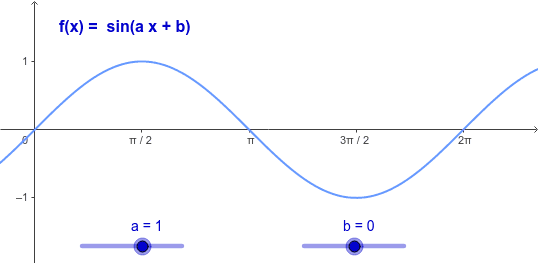
This example demonstrates the sine function sin(a x + b) and how its parameters change. Key mathematical concepts include trigonometry. By adjusting the values of a and b, you can observe changes in the sine function's graph. The construction summary mentions the use of GeoGebra commands a, b, f, and T1. Suitable for high school mathematics education and learning.
GeoGebra Commands & Parameters
Numeric a(1.0)Numeric b(0.0)f(x) = sin((a * x) + b)
AI Drawing Prompt Reference
Draw a Cartesian coordinate system with a sine curve plotted on it. The curve is defined by parameters a and b, where a controls the frequency (period) and b controls the horizontal shift. Initially, a equals 1 and b equals 0, giving the standard sine wave starting at the origin, with amplitude 1 and period 2π. Include two sliders to adjust a and b: changing a stretches or compresses the curve horizontally, while changing b shifts it left or right. Show the axes, grid lines, and the dynamic curve clearly so the effect of each parameter on the graph's shape is visible.
The prompt above was compiled from the original drawing commands and is for reference only.