
Sine Function Amplitude and Period
Loading the math board and drawing, please wait…
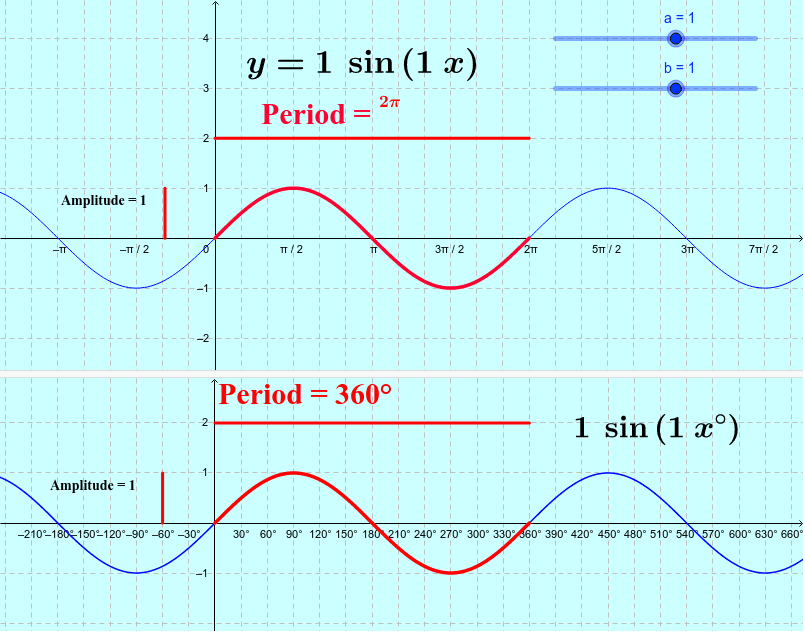
This example demonstrates the amplitude and period variations of the sine function. Key math concepts include sine function, amplitude, period, and symmetry. Construction involves using GeoGebra commands like Point, Segment, and Function to create the sine graph and related辅助 lines. Suitable for high school mathematics teaching or student exploration of function properties.
GeoGebra Commands & Parameters
Point(yAxis) → ASegment(A, B) → c_1Point(yAxis) → CSegment(C, D) → d_1Segment(E, F) → eSegment(G, H) → iFunction((a * sin(((b * (x - (c * 180 / π))))°)) + d, 0 + (c * 180 / π), 360 / abs(b) + (c * 180 / π)) → q
AI Drawing Prompt Reference
Draw a sine function graph to demonstrate amplitude and period variations. Start by creating two points A and C on the y-axis and drawing two auxiliary lines c₁ and d₁ through these points. Then create points E and F on the x-axis and draw lines e and i. Finally, use function q to draw the sine curve with amplitude a and period 1/|b|, starting at x = c * 180 / π and ending at x = 360 / |b| + c * 180 / π.
The prompt above was compiled from the original drawing commands and is for reference only.