
Sine, Cosine, and Tangent Curves
Loading the math board and drawing, please wait…
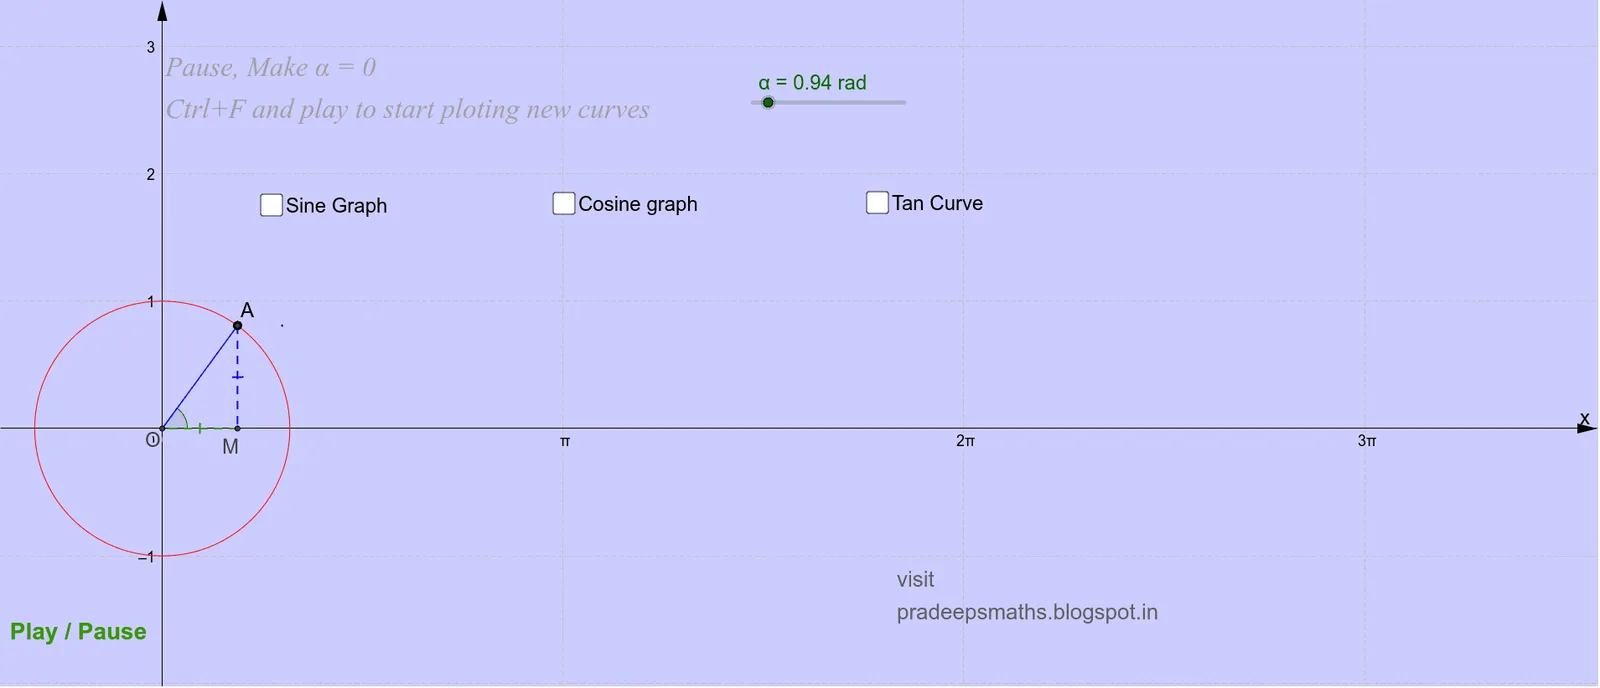
This example demonstrates the graphs of sine, cosine, and tangent functions, highlighting their relationships and transformations. Key math concepts include trigonometric functions, periodicity, and graph characteristics. Construction involves GeoGebra commands like Intersect, Circle, Rotate, Angle, Segment, and OrthogonalLine. Suitable for high school students studying trigonometric graphs.
GeoGebra Commands & Parameters
Intersect(xAxis, yAxis) → OCircle(O, 1) → cIntersect(c, xAxis, 2) → BRotate(B, α, O) → AAngle(B, O, A) → βCircle(D, 0.0040564) → gSegment(O, A) → aIntersect(c, a, 1) → GOrthogonalLine(G, xAxis) → hIntersect(h, xAxis) → MSegment(G, M) → iSegment(M, O) → j
AI Drawing Prompt Reference
Draw a coordinate system with a unit circle centered at the origin. Mark the intersection of the circle with the x-axis as B, rotate B around the origin by angle α to get A, and connect OA to intersect the circle at G. Draw a line perpendicular to the x-axis through G that intersects the x-axis at M. Connect GM and MO. Also, draw a small-radius circle centered at D to represent trigonometric function curves, highlighting the relationships and periodicity of sine, cosine, and tangent functions.
The prompt above was compiled from the original drawing commands and is for reference only.