
Sine and Unit Circle by Brian Paulson
Loading the math board and drawing, please wait…
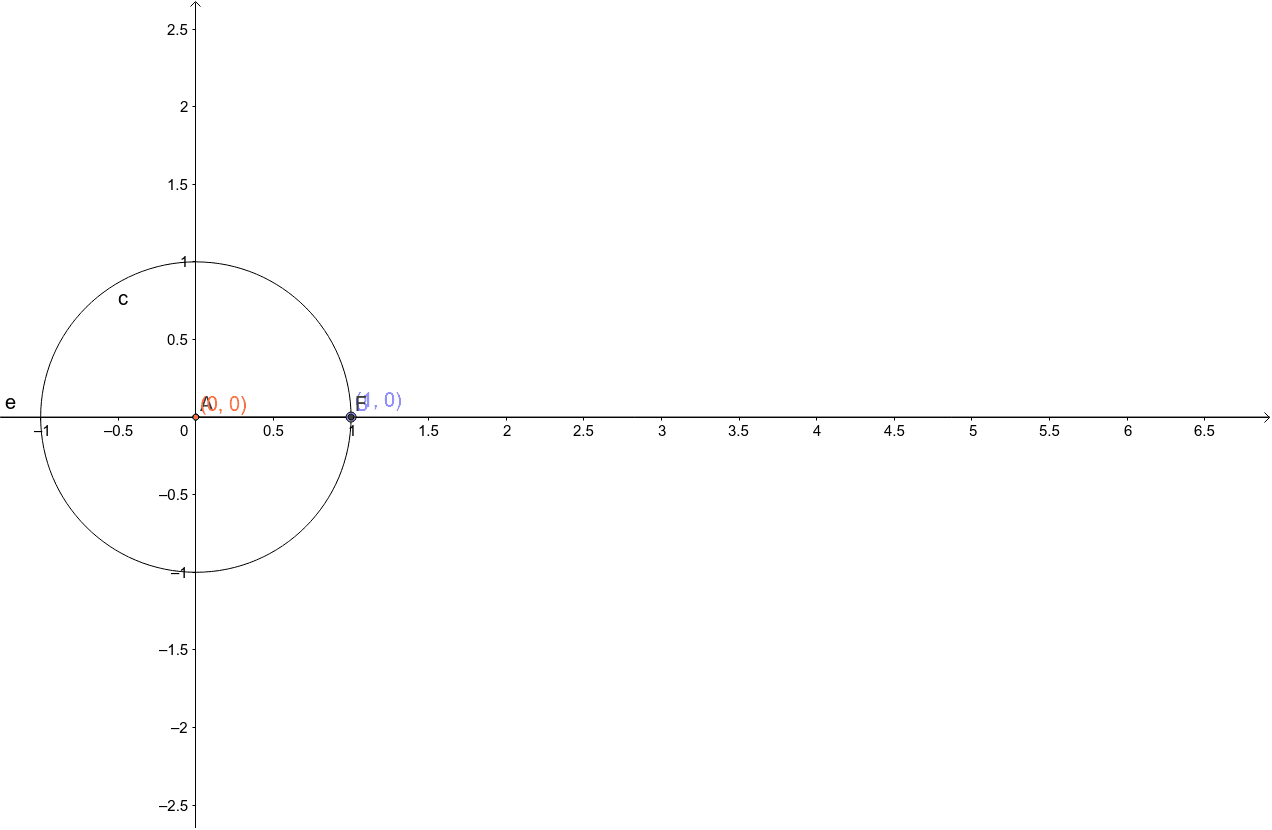
This example demonstrates the relationship between the sine function and the unit circle. Key mathematical concepts include the sine function and the unit circle. By constructing a circle, angle, line segment, and using commands like intersection, angle, orthogonal line, and line, the dynamic display of the sine function's graph can be shown. Suitable for high school mathematics education and learning.
GeoGebra Commands & Parameters
Intersect(xAxis, yAxis) → APoint(xAxis) → BCircle(A, B) → cPoint(c) → CAngle(B, A, C) → αSegment(A, C) → aOrthogonalLine(C, xAxis) → bOrthogonalLine(C, xAxis) → dPoint(xAxis) → ELine(E, B) → eIntersect(d, e) → FSegment(C, F) → f
AI Drawing Prompt Reference
Draw a unit circle and a sine function graph. The circle is centered at the origin with radius 1. Draw a horizontal axis and a vertical axis. Take a point on the circle, then draw a perpendicular from that point to the horizontal axis, marking the foot as A. Connect the origin to A to form a line segment. Draw a line from the origin to point C on the circle. The segment from the origin to C represents angle α. Draw a line from the origin to A, and a line from A to the horizontal axis. Connect A to the intersection of a line from C perpendicular to the horizontal axis and the line from A to the horizontal axis, getting point F. Finally, draw a line from the origin to F. The whole graph shows the relationship between the sine function and the unit circle, suitable for math learning.
The prompt above was compiled from the original drawing commands and is for reference only.