
Sine and the Unit Circle: Visualizing Angle Variation
Loading the math board and drawing, please wait…
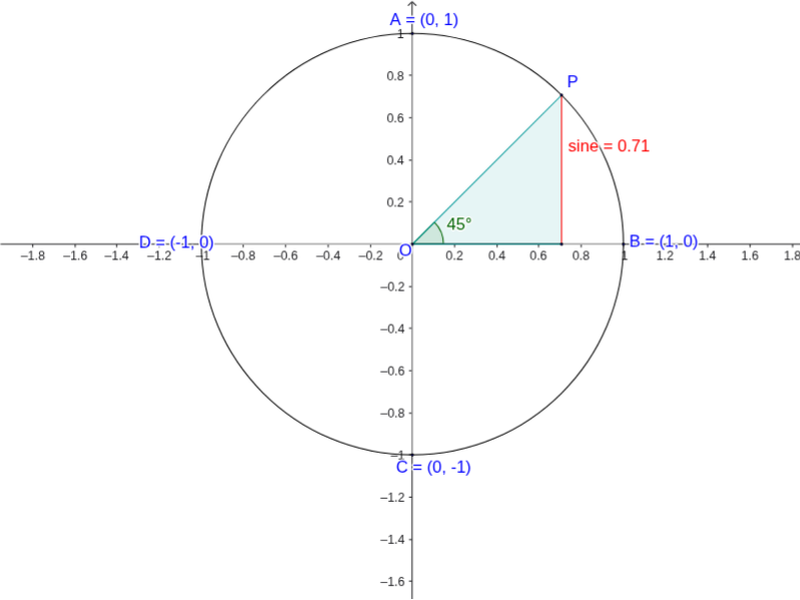
This example uses the unit circle to demonstrate how the sine varies as the central angle changes. The core mathematical concepts include the sine function, trigonometry, properties of the unit circle, angle measurement, and coordinate geometry. The construction employs GeoGebra commands such as Intersect, Point, Circle, Segment, OrthogonalLine, Polygon, and Angle, and defines objects like O, B, g, A, etc., to build the unit circle and the sine curve. It is suitable for high‑school mathematics (required/elective) and university introductory trigonometry courses, as well as for mathematical modeling and intuitive teaching.
GeoGebra Commands & Parameters
Intersect(xAxis, yAxis) → OPoint(xAxis) → BCircle(O, B) → gPoint(g) → AIntersect(g, xAxis, 2) → DSegment(D, B) → aPoint(g) → PSegment(P, O) → eOrthogonalLine(P, a) → bIntersect(b, a) → ESegment(P, E) → sineSegment(E, O) → e_2Polygon(O, E, P) → poly1, f, o_1, e_1Intersect(g, yAxis, 1) → CSegment(A, C) → iSegment(O, B) → hAngle(B, O, P) → α
AI Drawing Prompt Reference
Please draw a diagram that demonstrates the relationship between the sine function and the unit circle. First, draw a unit circle with its center at the origin of the coordinate axes. Select a point on the circle to represent the varying angle, and connect this point to the origin. Then, draw a vertical line from this point down to the x-axis, finding their intersection. Finally, connect this intersection back to the origin, forming a triangle that shows the variation in sine values.
The prompt above was compiled from the original drawing commands and is for reference only.