
Sine and Cosine Graph Explorer
Loading the math board and drawing, please wait…
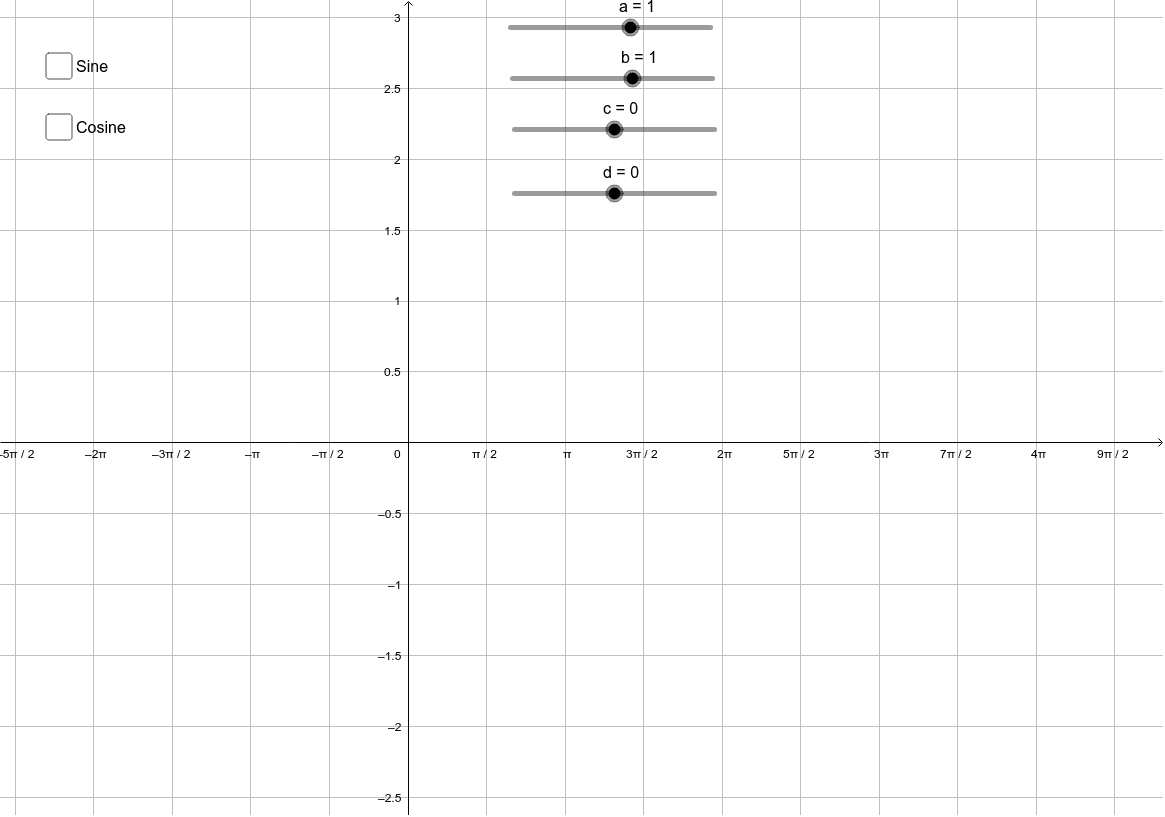
This GeoGebra example demonstrates how the graphs of a*sin(b(x-c))+d and a*cos(b(x-c))+d change as the parameters a, b, c, and d vary. It highlights amplitude, period, horizontal phase shift, and vertical translation in trigonometric functions. The construction summary lists parameter objects a, b, c, d, function objects f, e, g, h, and text objects text1 and text2, indicating that the applet uses parameter variables, function expressions, and text labels to compare sine and cosine transformations. It is suitable for high school trigonometry, function graphing, transformation exploration, and classroom or self-study use.
GeoGebra Commands & Parameters
Numeric a(1.0)Numeric b(1.0)Numeric c(0.0)Numeric d(0.0)f(x) = (a * sin((b * (x - c)))) + dBoolean e(false)g(x) = (a * cos((b * (x - c)))) + dBoolean h(false)