
Sine and Cosine Curves
Loading the math board and drawing, please wait…
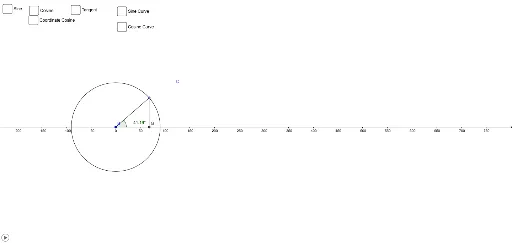
This example demonstrates the sine and cosine curves. It involves core concepts of trigonometry and uses GeoGebra commands such as Circle, Point, Segment, Intersect, etc., to visually understand the properties of sine and cosine functions. Suitable for high school mathematics education and learning.
GeoGebra Commands & Parameters
Circle(B, A) → cPoint(c) → CPoint(c) → DSegment(B, C) → aOrthogonalLine(C, yAxis) → dOrthogonalLine(D, xAxis) → eIntersect(d, e) → ESegment(D, E) → fSegment(C, E) → gSegment(D, C) → hAngle(C, E, D) → αAngle(xAxis, a) → βAngle(C, B, D) → γAngle(E, C, B) → δAngle(E, D, C) → εLine(C, yAxis) → bIntersect(b, xAxis) → GSegment(C, G) → i
AI Drawing Prompt Reference
Draw a graph of sine and cosine curves. First, draw a circle. Then, mark two points on the circle. Next, draw line segments connecting these points. Draw perpendicular lines from these points to the axes. Find the intersection point of these perpendicular lines. Then, draw some angles and lines to show the relationship between sine and cosine functions. Finally, connect points on the circle to points on the axes to form line segments.
The prompt above was compiled from the original drawing commands and is for reference only.