
Simultaneous Equations Involving a Quadratic Equation
Loading the math board and drawing, please wait…
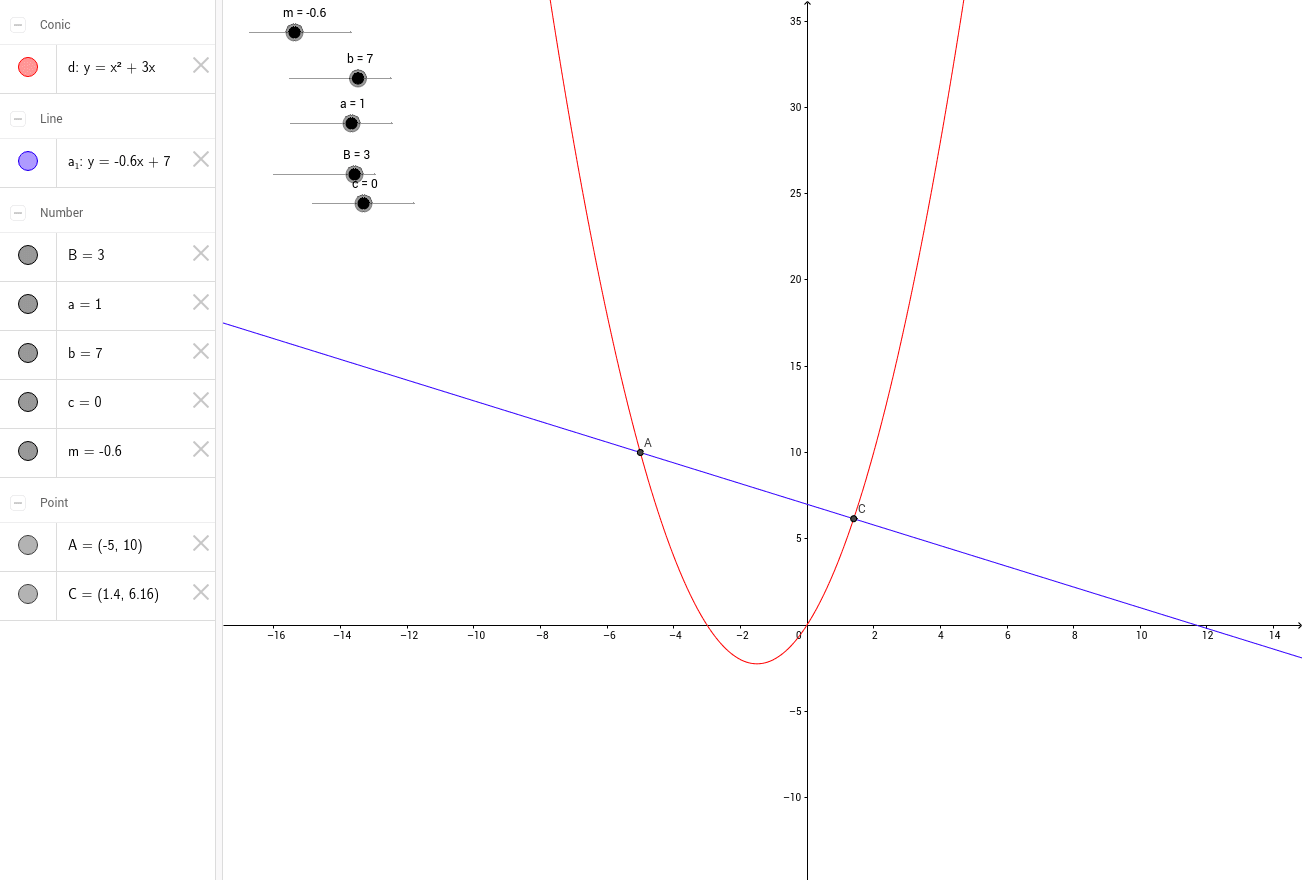
This GeoGebra example demonstrates solving a system of simultaneous equations where at least one is quadratic, by visualizing the intersection points of the corresponding curves. The core mathematical concept is the geometric interpretation of simultaneous equations: the solution set corresponds to the coordinates where the graphs of all equations meet. The construction uses the Intersect command on objects labeled m, b, a_1, a, B, c, d, A, and C, which likely represent function graphs or geometric loci, to compute and display the intersection points as the solutions. This is suitable for middle or high school students learning algebra and coordinate geometry, reinforcing the link between algebraic solving and graphical representation, and introducing the practical use of GeoGebra's Intersect tool for equation systems.
GeoGebra Commands & Parameters
Intersect(d, a_1, 2) → AIntersect(d, a_1, 1) → C
AI Drawing Prompt Reference
Draw a coordinate plane with a quadratic curve and another curve (likely a line) intersecting it. Mark the two intersection points clearly with dots. The graph should illustrate the geometric solution of a system of equations involving a quadratic, where the intersection coordinates represent the solutions. Construct the quadratic first, then the second curve, and finally highlight the two intersection points.
The prompt above was compiled from the original drawing commands and is for reference only.