
Ship Radar Plot: Position, Speed, Velocity and Collision
Loading the math board and drawing, please wait…
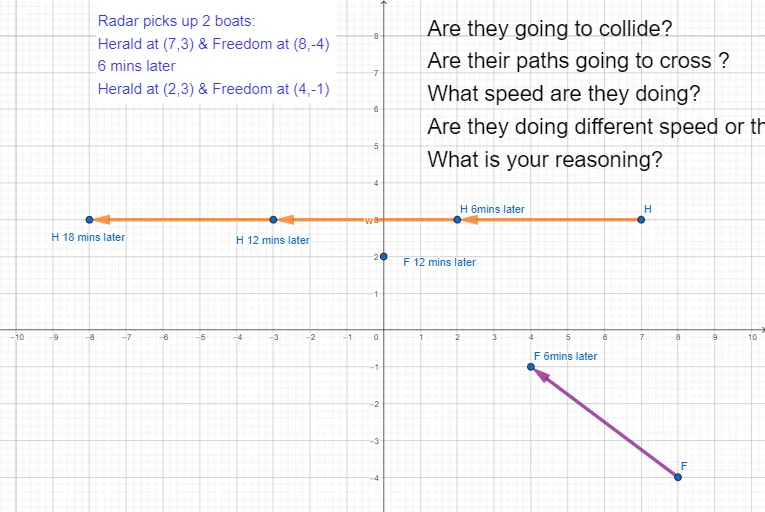
① This example uses a radar-style plot to show two ships moving on different courses, allowing students to visually determine whether they will collide. ② Core mathematical concepts include 2D vectors (position and velocity), intersection of straight lines, relative motion, and collision conditions. ③ Construction highlights: using GeoGebra's Vector command to create velocity vectors u and v, Point command to define ship positions A and B, and additional points F, H, H_1, C, D, E along with lines a, b, c and text objects text1, text2 to display real-time data, enabling dynamic simulation. ④ Suitable for high school or university courses in physics/mathematics focusing on vector applications and line intersections, as well as introductory demonstrations in maritime or traffic simulation.
GeoGebra Commands & Parameters
Vector(H, H_1) → uVector(F, B) → vVector(H_1, A) → wVector(A, C) → aPoint(yAxis) → DVector(B, D) → bVector(D, E) → c
AI Drawing Prompt Reference
Draw a radar plot showing two ships moving on different courses, displaying their positions, speeds, and velocity vectors. Use sliders to control the ships' positions, and vectors u and v to represent their speeds, with vector w for relative speed. Draw lines a, b, and c to represent the ships' paths, and add points D and E to show real-time data. Finally, add text objects text1 and text2 to display collision conditions.
The prompt above was compiled from the original drawing commands and is for reference only.