
Shifting Linear Functions
Loading the math board and drawing, please wait…
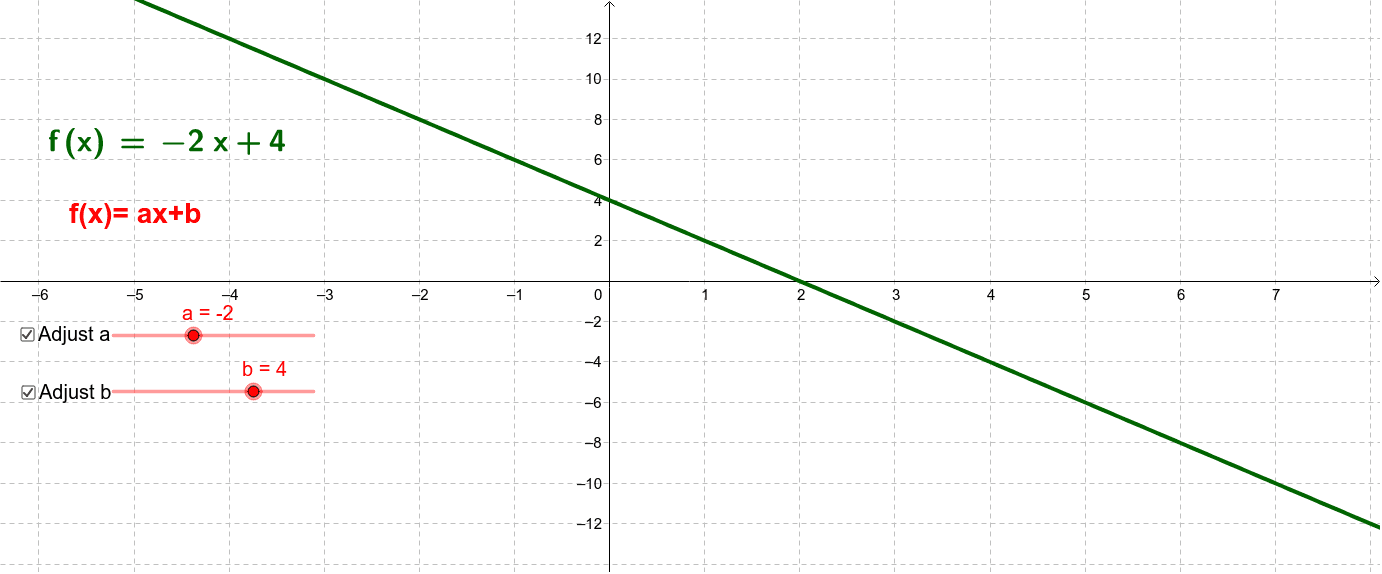
This example demonstrates the dynamic changes in a linear function's graph as its parameters are adjusted. Key math concepts include the properties of linear functions, the impact of parameters on function graphs, and translation transformations of function graphs. GeoGebra commands/objects used: variables a, b for parameters, function f for the linear function, text1-4 for annotations, d, e for auxiliary variables, and slider for dynamic adjustments. Suitable for high school mathematics teaching to visually understand the relationship between parameters and function graphs, enhancing comprehension of function transformations.
GeoGebra Commands & Parameters
LaTeX(f, true, true) → text1
AI Drawing Prompt Reference
Draw a dynamic graph showing how a linear function changes as its parameters are adjusted. Include two parameter variables, a linear function, and text annotations. Use sliders to dynamically change the parameters and observe the translation transformations of the function graph, labeling key mathematical concepts and the impact of parameters.
The prompt above was compiled from the original drawing commands and is for reference only.