
Shifting Cosine: Visualizing Transformations of the Cosine Function
Loading the math board and drawing, please wait…
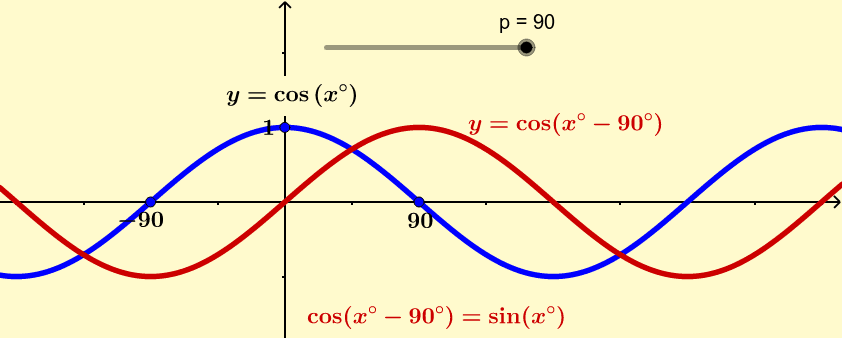
①This example dynamically demonstrates how the cosine function's graph shifts horizontally and vertically when parameters are adjusted, making the geometric meaning of function transformations clear. ②Core mathematical concepts include trigonometric functions, horizontal (phase) and vertical shifts, symmetry, and the relationship between algebraic expressions and their graphs. ③Construction highlights: from the summary, multiple points (A1 to A10) mark key locations on the curve, line segments create a reference grid, linear regression is used to fit data points and verify the shifted function's shape, and text objects (text1 to text8) label parameters and coordinates; functions f and g represent the original and shifted cosine curves respectively. ④This is suitable for high school or introductory college students learning trigonometric graph transformations, and for teachers demonstrating how parameter changes affect the graph in real time.
GeoGebra Commands & Parameters
f(x) = cos(x°)1A1 + 1A2 + 1A3 + 1A4 + 1A5 + 1A6 + 1A7 + 1A8 + 1A9 + 1Numeric p(90.0)(0, 1)g(x) = cos(x° - p°)(p, 1)(90, 0)(-90, 0)
AI Drawing Prompt Reference
Draw a coordinate plane with a standard cosine curve and a horizontally shifted cosine curve. The standard curve starts near the origin, passes through its maximum and minimum, with a period of 360 degrees. The shifted curve is moved right by 90 degrees, keeping the same shape. Mark several key points on both curves, and connect them with line segments to form a reference grid. Add a fitted line to verify the shape of the shifted curve. Label parameter values, such as the shift amount, and use text to indicate coordinates. Use a slider to control the shift amount, dynamically showing how the curve moves left or right as the parameter changes.
The prompt above was compiled from the original drawing commands and is for reference only.