
Shifting a Parabola: Dynamic Visualization of Vertex and Equation Changes
Loading the math board and drawing, please wait…
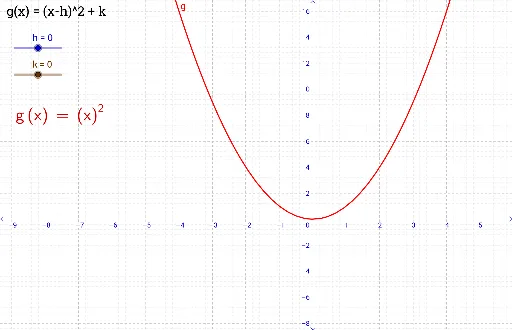
① This GeoGebra example dynamically demonstrates how a parabola moves in the plane, showing the effect of translations on its graph. ② The core mathematical concepts are transformations of quadratic functions, specifically horizontal and vertical shifts affecting the vertex, axis of symmetry, and the function's equation, involving functions, coordinate geometry, and transformation ideas. ③ Construction highlights: using GeoGebra commands to create objects k, h, g, and text1, text2 for dynamic labels; sliders or drag controls adjust translation amounts, updating the parabola's equation and graph in real time; LaTeX rendering is used for clear mathematical expressions. ④ Suitable for middle and high school students learning properties of quadratic functions, as well as for teacher demonstrations or student self-exploration to understand the correspondence between geometric shifts and algebraic representations.
GeoGebra Commands & Parameters
LaTeX(g, true, true) → text1